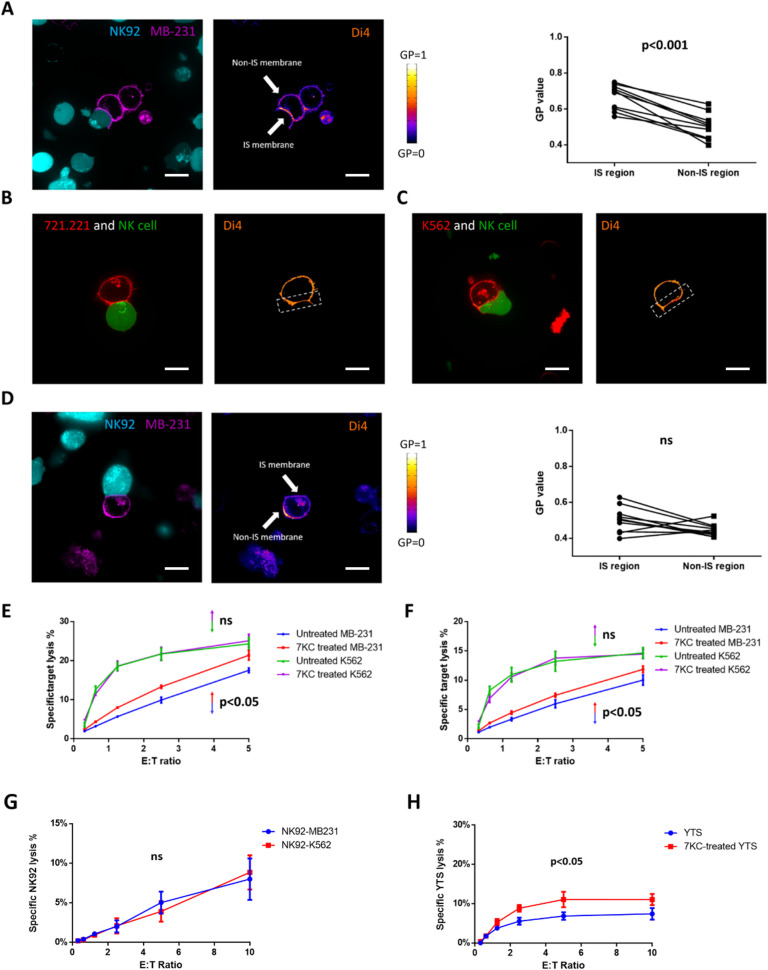
Fig 7. Cancer cells can evade NK cell killing by generating densely packed postsynaptic lipid membranes.
The lipid packing of target cell membranes in Di4-ANEPPDHQ (Di4) fluorescent packing sensor labeled MB-231 cells (A, left), 721.221 cells (B), K562 cells (C), and 7KC-pretreated MB-231 cells (D, left) conjugated with calcein green–loaded YTS or NK92 cells, respectively, was measured using confocal microscopy. Representative images of 15–30 conjugates over 3 independent experiments are shown. In each image pair, the left image shows the effector cell demonstrating calcein green fluorescence (A, teal; B, green; C, green; D, teal) and target cell demonstrating cell mask fluorescence (A, purple; B, red; C, red; D, purple). The right image shows target cells are overlaid with a pseudocolor scale (A–D) to demonstrate differences in packing and density. Example synaptic regions were denoted by arrows (A) or boxes (B, C) in the images. The GP value was measured in independent experiments (n = 10 for untreated MB-231 and n = 10 for 7KC-pretreated MB-231), and a paired t test was used for statistical comparison between the individual values for synaptic and nonsynaptic regions (A, right and D, right). (E, F) 7KC was used to disrupt membrane packing in either K562 (purple line) or MB-231 (red line) target cells and were incubated with NK92 cells (E) or human NK cells (F) and evaluated in a 4-h 51Cr release cytotoxicity assay. The specific lysis of 7KC-treated target cells were compared to that of untreated MB-231 (blue line) or K562 (green line), and the p-value shown is for the MB-231 (p < 0.05) or K652 (p > 0.05, ns) target cells. (G) Survival of NK92 cells incubated with nonresistant targets K562 or resistant targets MB-231 was measured by 4-h 51Cr release assay. (H) Survival of untreated or 7KC-pretreated YTS cells incubated with NK92 cells was measured by 4-h 51Cr release assay in which the YTS cells were 51Cr labeled. Data represent results from 3 independent experiments using NK cell lines or eNK cells from 3 healthy donors and error bars show ± SD (E−H). Wilcoxon signed rank test was used for the comparison between curves. Scale bar: 10 μm. eNK, ex vivo NK; GP, generalized polarization; IS, immunological synapse; NK, natural killer; ns, not significant; 7KC, 7-ketocholesterol.

