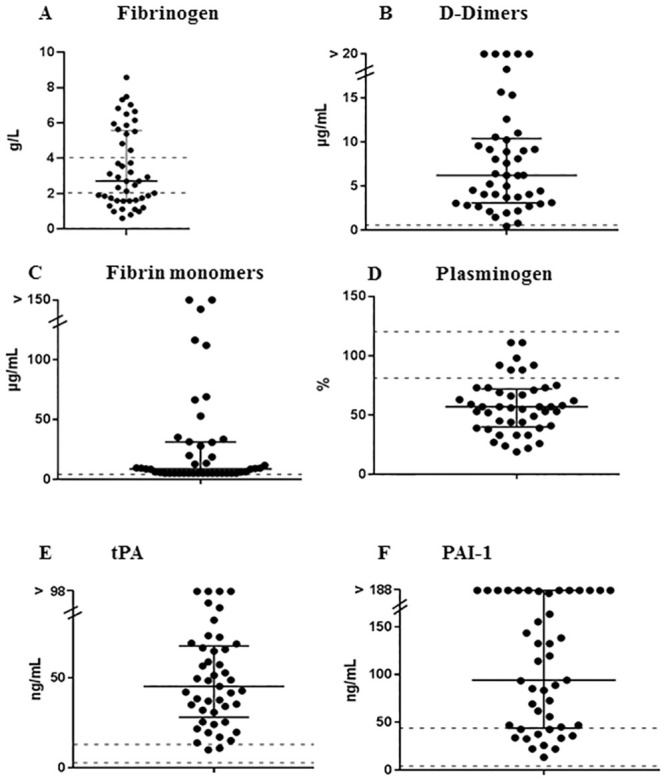
Fig 1. Investigation for fibrinolysis-related parameters in 45 patients with HLH.

Each patient is represented by an icon. (A) fibrinogen; (B) D-dimers; (C) fibrin monomers; (D) plasminogen; (E) t-PA; (F) PAI-1.; normal ranges are represented as dashed lines; medians and IQR are represented as black lines.
