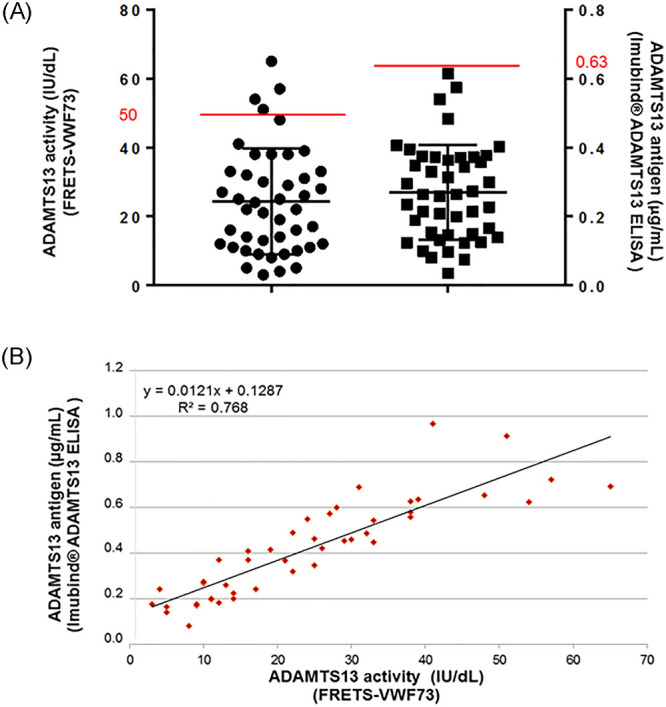
Fig 2. Investigation for ADAMTS13 in 45 patients with HLH.

(A) Each patient is represented by an icon; ADAMTS13 activity and ADAMTS13 antigen levels are represented in the same graph; the upper limit of normal ranges are represented as red lines; medians and IQR are represented as black lines. (B) Correlation curve between ADAMTS13 activity and ADAMTS13 antigen.
