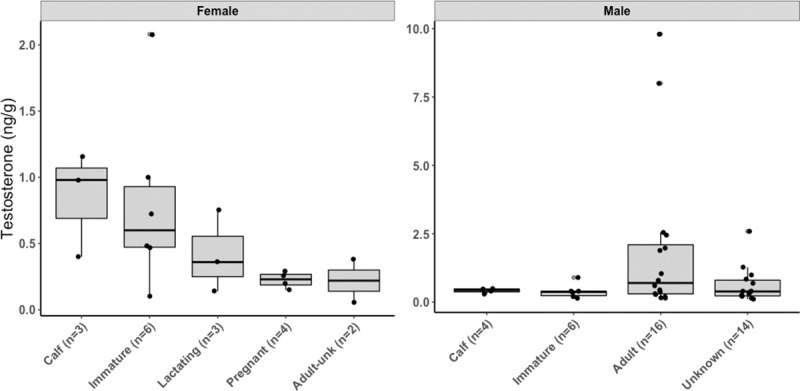
Fig 4. Testosterone concentrations (ng/g) in gray whale of different reproductive states (females) and age class (males).

In females, testosterone concentrations were not statistically different among reproductive groups (ANOVA: F = 1.9, df = 4, P = 0.2). Boxplots denote median (thick line), upper (75%) and lower (25%) quartile (boxes) and largest and smallest value within 1.5 times interquartile range below 25% and above 75% (whiskers). Outside values are shown as filled circles.
