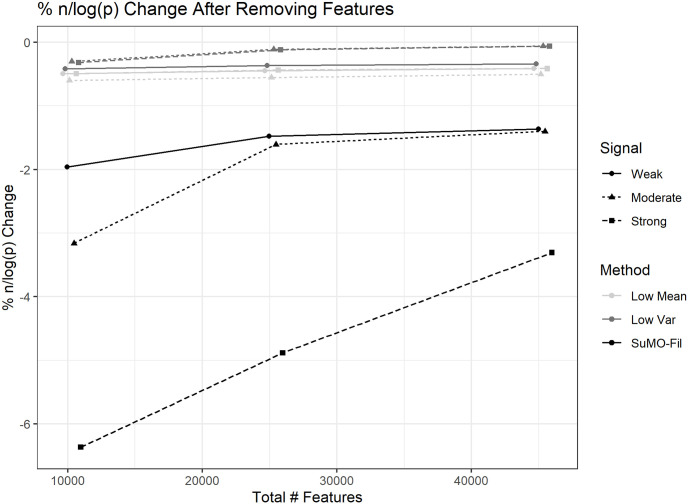
Fig 4. Percent change in sparsity.
The average percent change in n/log(p) before and after removing features across the simulations from the nine different settings and the corresponding confidence interval bars. The points on each line correspond to small, medium, and large simulations from left to right. Also note that the total number of features is the number of features within both and combined, prior to any removing of features. Due to the high number of simulations, the confidence interval bars are very tight.

