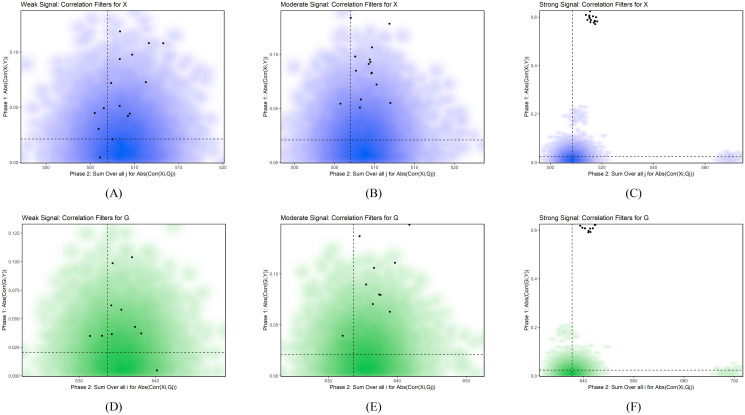
Fig 5. Representative simulations.
This figure shows representative simulations for weak, moderate, and strong signal strength under the simulations with a large number of features (45305). The black points represent the features that belong to the network. The dashed lines within each plot represents the k-means cluster threshold obtained from the SuMO-Fil method, where all points within the bottom left quadrant of each plot represent the features that will be removed. Plots (A) and (D) correspond to the correlation measures for and , respectively, for a representative simulation under the weak signal setting; plots (B) and (E) correspond to the correlation measures for and , respectively, for a representative simulation under the moderate signal setting; plots (C) and (F) correspond to the correlation measures for and , respectively, for a representative simulation under the strong signal setting. In (A), we see 1 point (network feature) in the bottom left quadrant that would be erroneously removed from the SuMO-Fil method.

