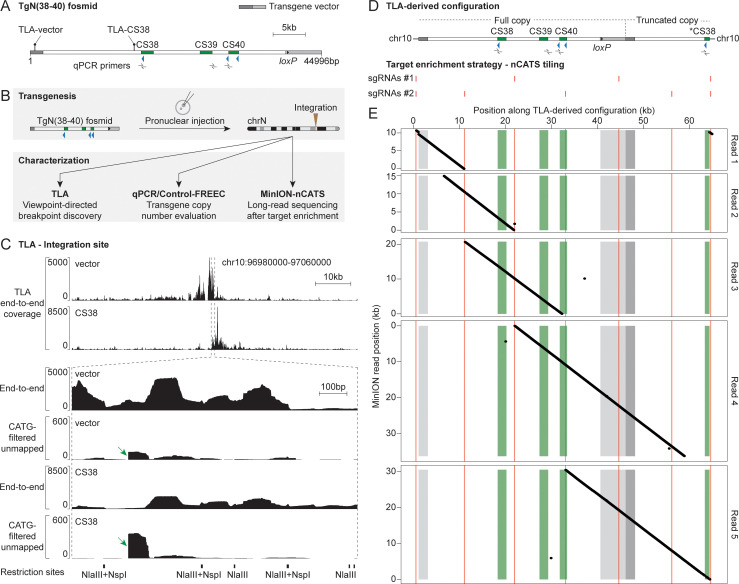
Fig 2. Characterization of the TgN(38–40) integration.
(A) Schematic representation of the TgN(38–40) fosmid, vector in gray. Position of TLA viewpoints (lollipops) and qPCR primers (left to right: CS38, CS39 and CS40a) is indicated. (B) Transgenesis and characterization workflow. (C) Analysis of the TgN(38–40) integration by TLA. Top, TLA end-to-end coverage around the candidate integration site. Bottom, magnification of the above-mentioned area. Both end-to-end and CATG-filtered unmapped coverages are shown. Green arrows highlight sharp drops in the CATG-filtered unmapped signal. TLA restriction sites are shown below. (D) Top, TLA-derived genomic configuration. Asterisk, second partial CS38 element. Bottom, position of the two distinct pools of sgRNAs used for nCATS. (E) Analysis of the TgN(38–40) integration using MinION-nCATS. Dot plot representation of five selected MinION reads (ranging from 10 to 35 kb) along the TLA-derived configuration (horizontal axis), color-coded as in (D). The ~600 bp duplication of chromosome 10 sequence manifests as a subtle discontinuity in read 1 on the left as well as a small diagonal on the right.

