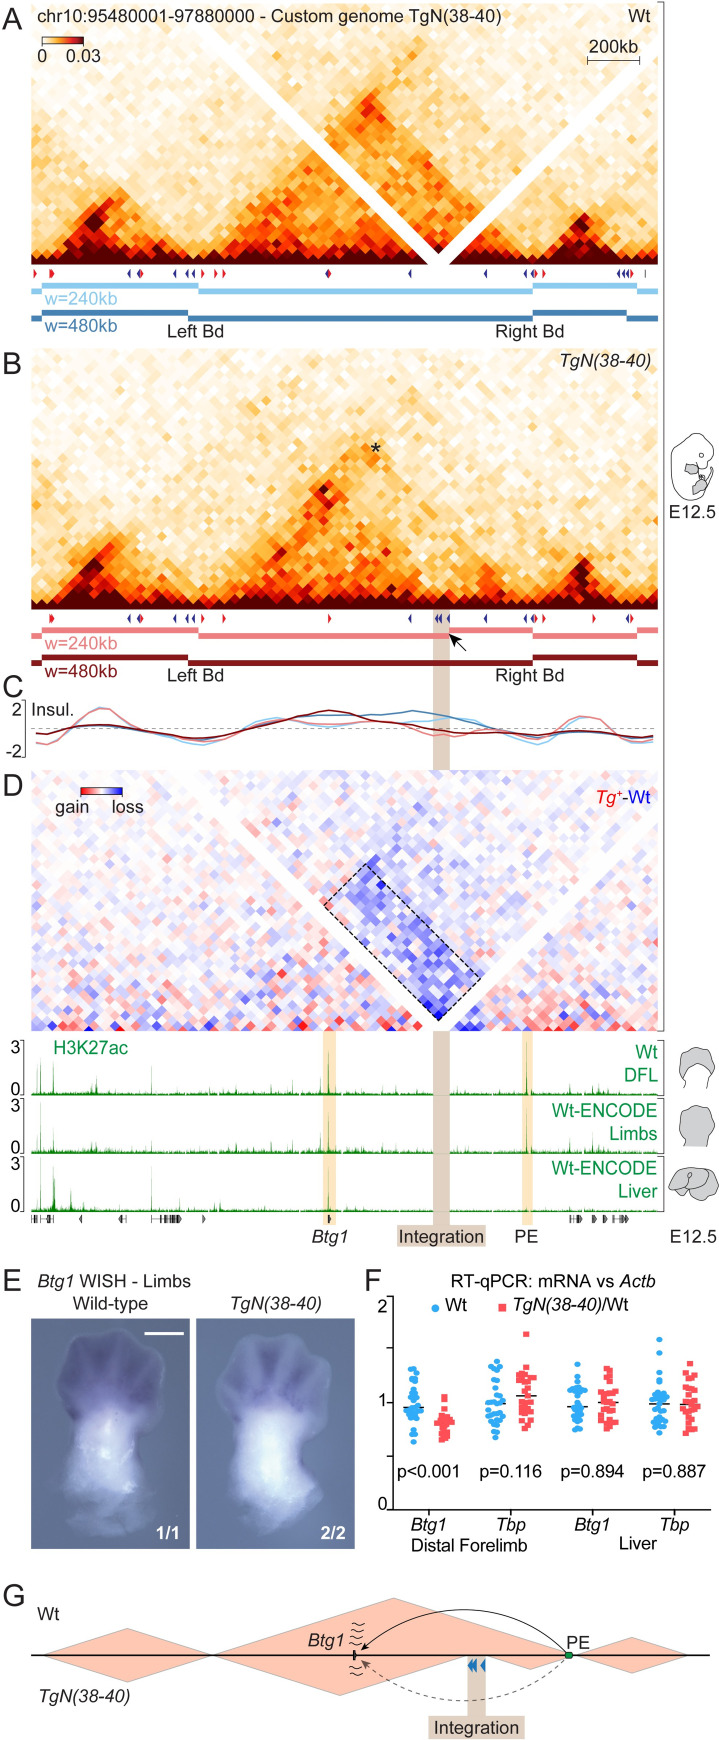
Fig 4. Reconstitution of a sub-TAD boundary in the host landscape.
(A) Wild-type and (B) mutant TgN(38–40) Hi-C matrices of the host locus in whole limbs at E12.5. Corresponding CTCFs (red or blue arrowheads) and topological domains (horizontal bars) are shown. Below each panel, TAD-separation, color-coded according to the applied window size. The arrow indicates a new boundary at the level of the integration. (C) Insulation scores using two different window sizes. (D) Differential Hi-C heatmap (TgN(38–40)-Wt). Quantification of contacts changes between regions located across the TgN(38–40) integration site (dashed box), -39% (p-value = 2e-29). H3K27ac ChIP tracks. (E) Btg1 WISH in wild-type and TgN(38–40) homozygous E12.5 forelimbs. Scale bar: 500 μm. Fractional numbers indicate the proportion of embryos displaying equivalent patterns in the experiment. (F) RT-qPCR values of Btg1 and Tbp (internal control) in E12.5 distal forelimbs and liver. mRNAs levels were referenced to Actb (Wt = 31, TgN(38-40)/Wt = 27); p-values were obtained by Welch’s t-test. (G) Proposed mechanistic model of Btg1 expression changes. PE, putative Btg1 enhancer (green oval). Enhancer-promoter communication is represented with arrows.

