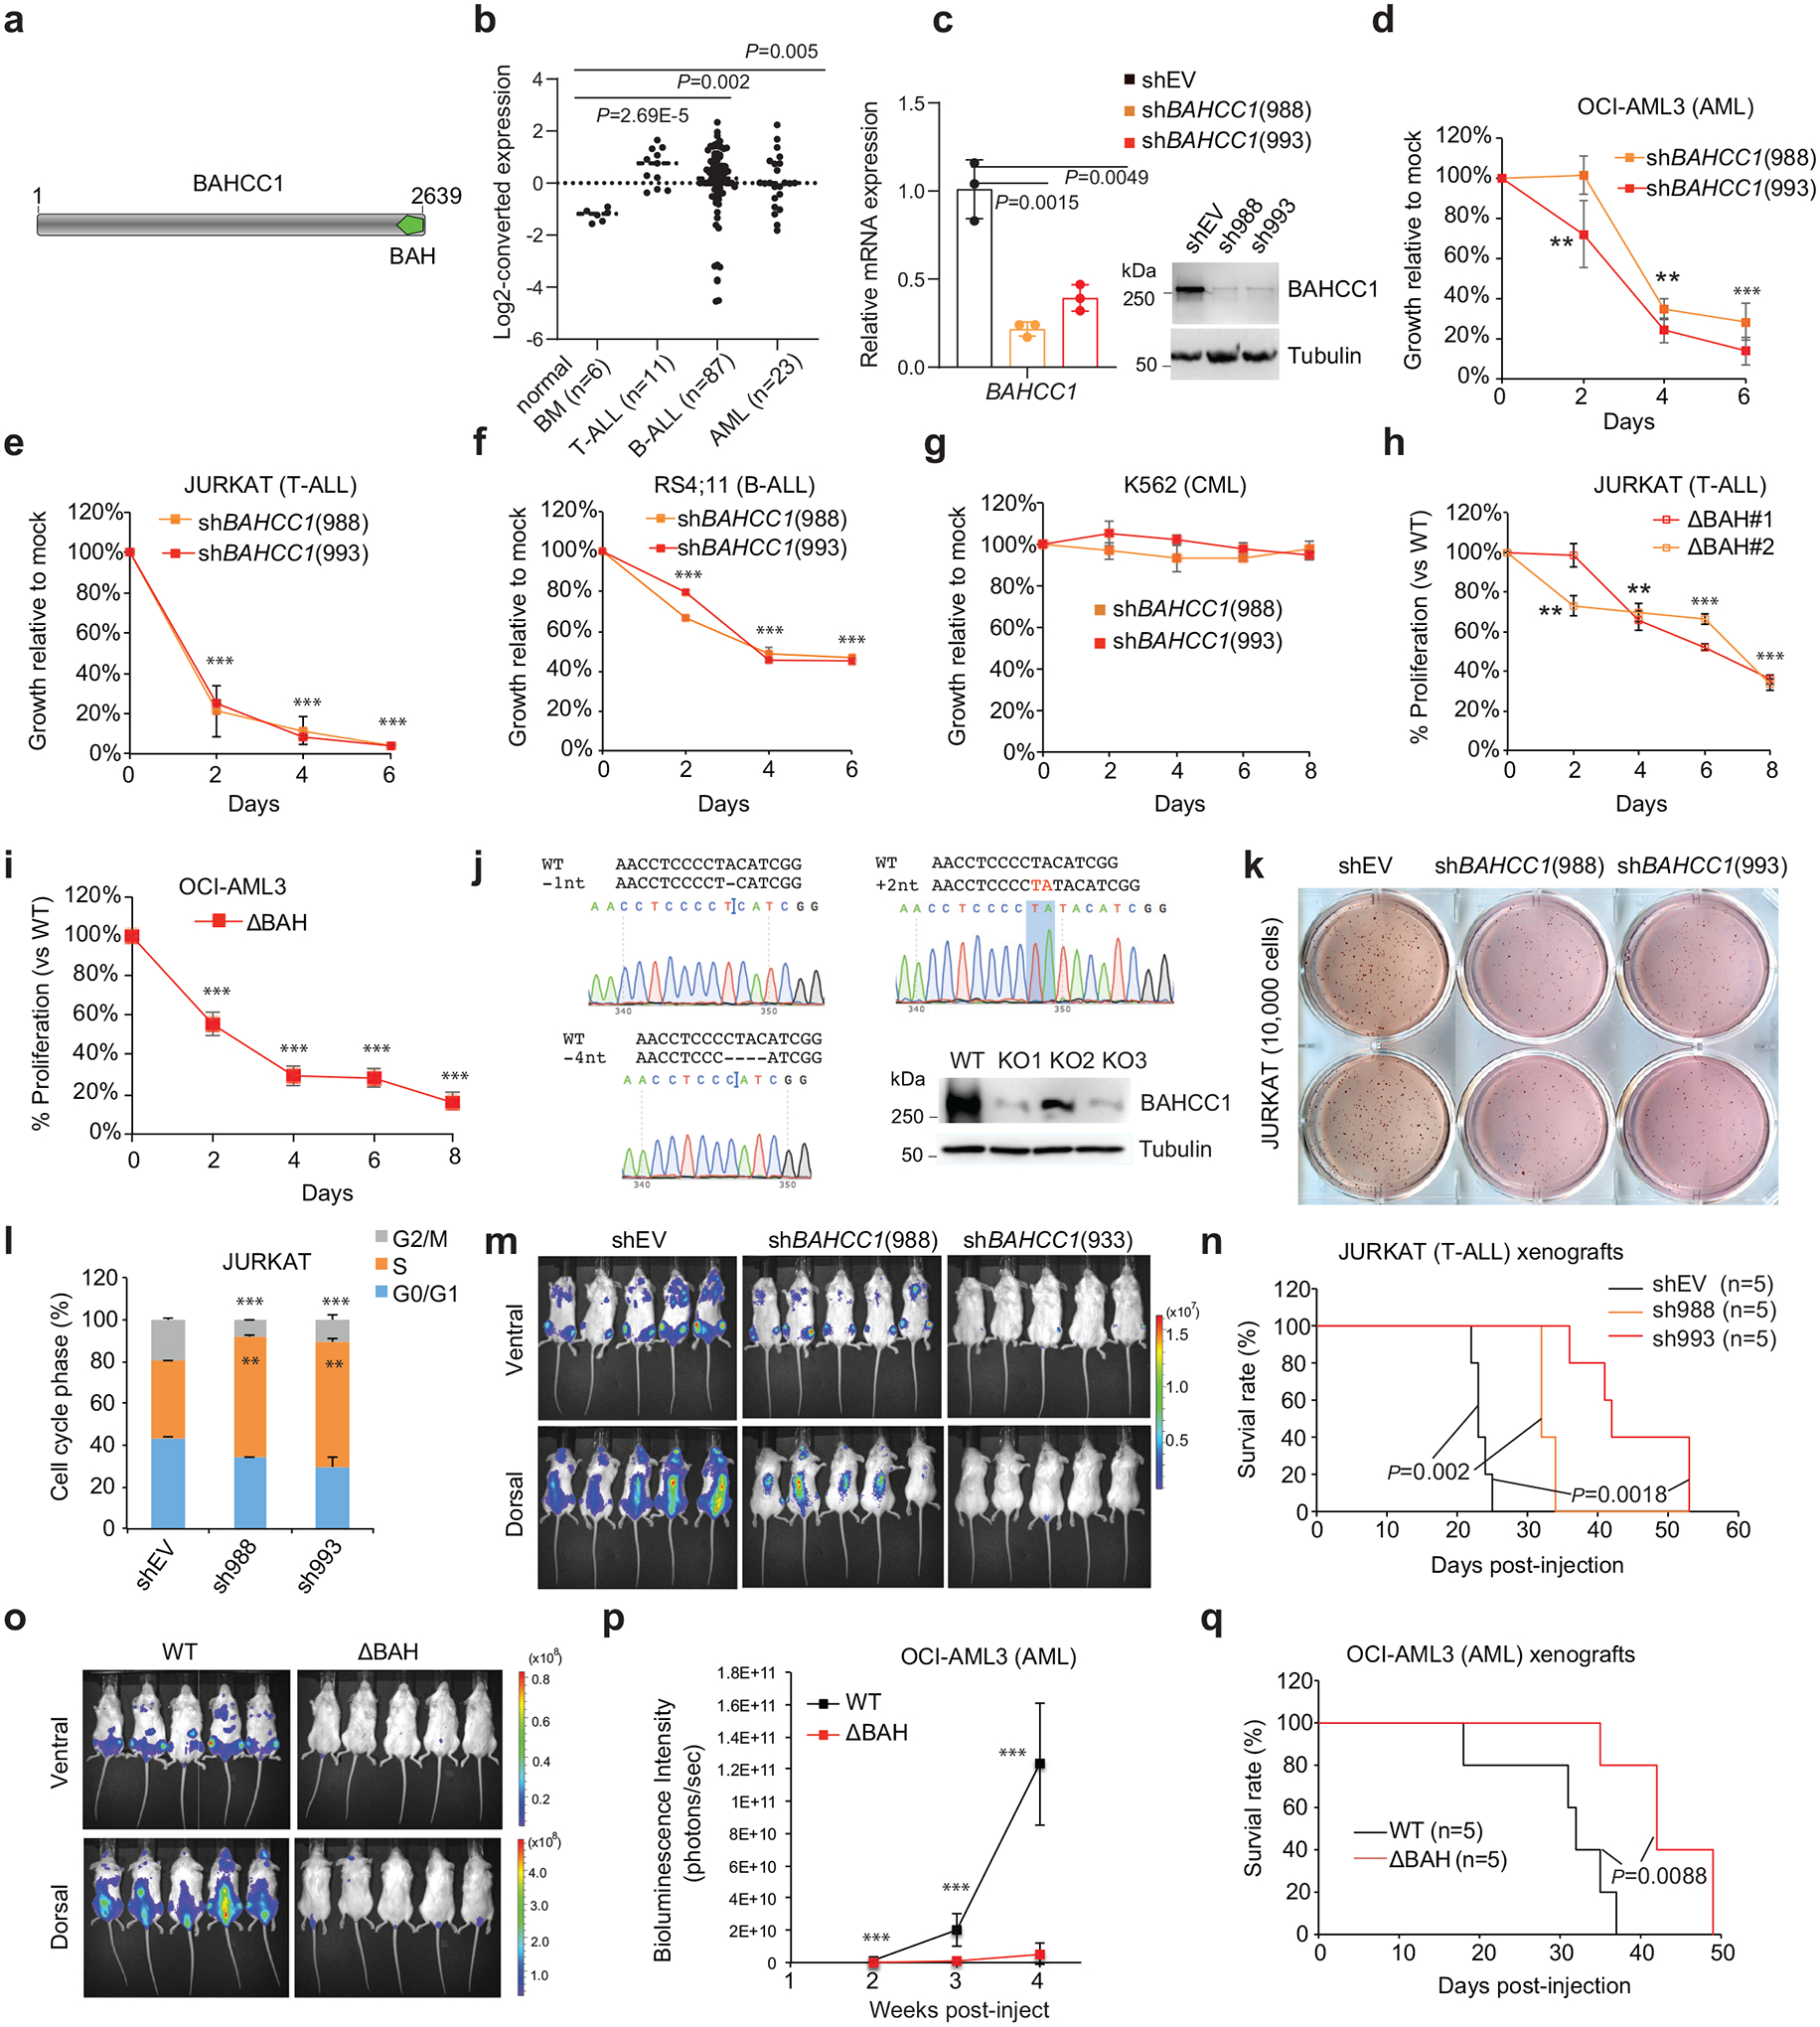
Fig. 1. BAHCC1 sustains acute leukemia cell growth in vitro and in vivo.

a, Domain architecture of BAHCC1.
b, Dot plot showing BAHCC1 overexpression in primary T-ALL, B-ALL and AML samples, relative to normal tissues, based on GEO dataset GSE7186.
c, RT-qPCR (left) and immunoblots (right) of BAHCC1 after its knockdown (KD) in JURKAT cells (n = 3 biologically independent samples). Data are presented as mean ± SD.
d-g, Proliferation of the indicated cells, OCI-AML3 (d), JURKAT (e), RS4;11 (f) or K562 (g), post-KD of BAHCC1 relative to mock-treated control (n = 3 biologically independent experiments). Data are presented as mean ± SD. ** P < 0.01; *** P < 0.001.
h-j, Proliferation of JURKAT T-ALL (h) and OCI-AML3 AML cells (i) following CRISPR-cas9-mediated disruption of the BAHCC1 BAH domain (BAHCC1BAH), relative to WT (n = 3 biologically independent experiments). Data are presented as mean ± SD. Panel j, Sanger sequencing for detecting homozygous frame-shift mutation of BAHCC1 and immunoblotting for BAHCC1 knockout (KO) mediated by sgRNAs that target exons encoding BAHCC1BAH. ** P < 0.01; *** P < 0.001.
k, Representative images of colonies formed by JURKAT cells, either mock-treated (shEV) or post-KD of BAHCC1 (n = 2 biologically independent experiments).
l, Quantification of cell cycle phases using JURKAT cells, either mock-treated or post-KD of BAHCC1 (n = 3 biologically independent experiments). ** P < 0.01; *** P < 0.001. Data are presented as mean ± SD.
m-n, Bioluminescence imaging (m; three weeks post-transplantation) and Kaplan-Meier survival curve (n) of NSG mice xenografted with luciferase-labeled JURKAT cells, either mock-treated (shEV) or stably transduced with a BAHCC1-targeting shRNA. P values were calculated by log-rank test; n, cohort size.
o-q, Bioluminescence imaging (o; two weeks post-transplantation), summary of bioluminescence signals (p; from dorsal imaging; n = 5 mice, with data presented as mean ± SD) and Kaplan-Meier curve (q) of NSG mice xenografted with luciferase-labeled OCI-AML3 AML cells that harbor the CRISPR-cas9-caused frameshift mutation within BAHCC1BAH, relative to WT. n, cohort size. *** P < 0.001.
