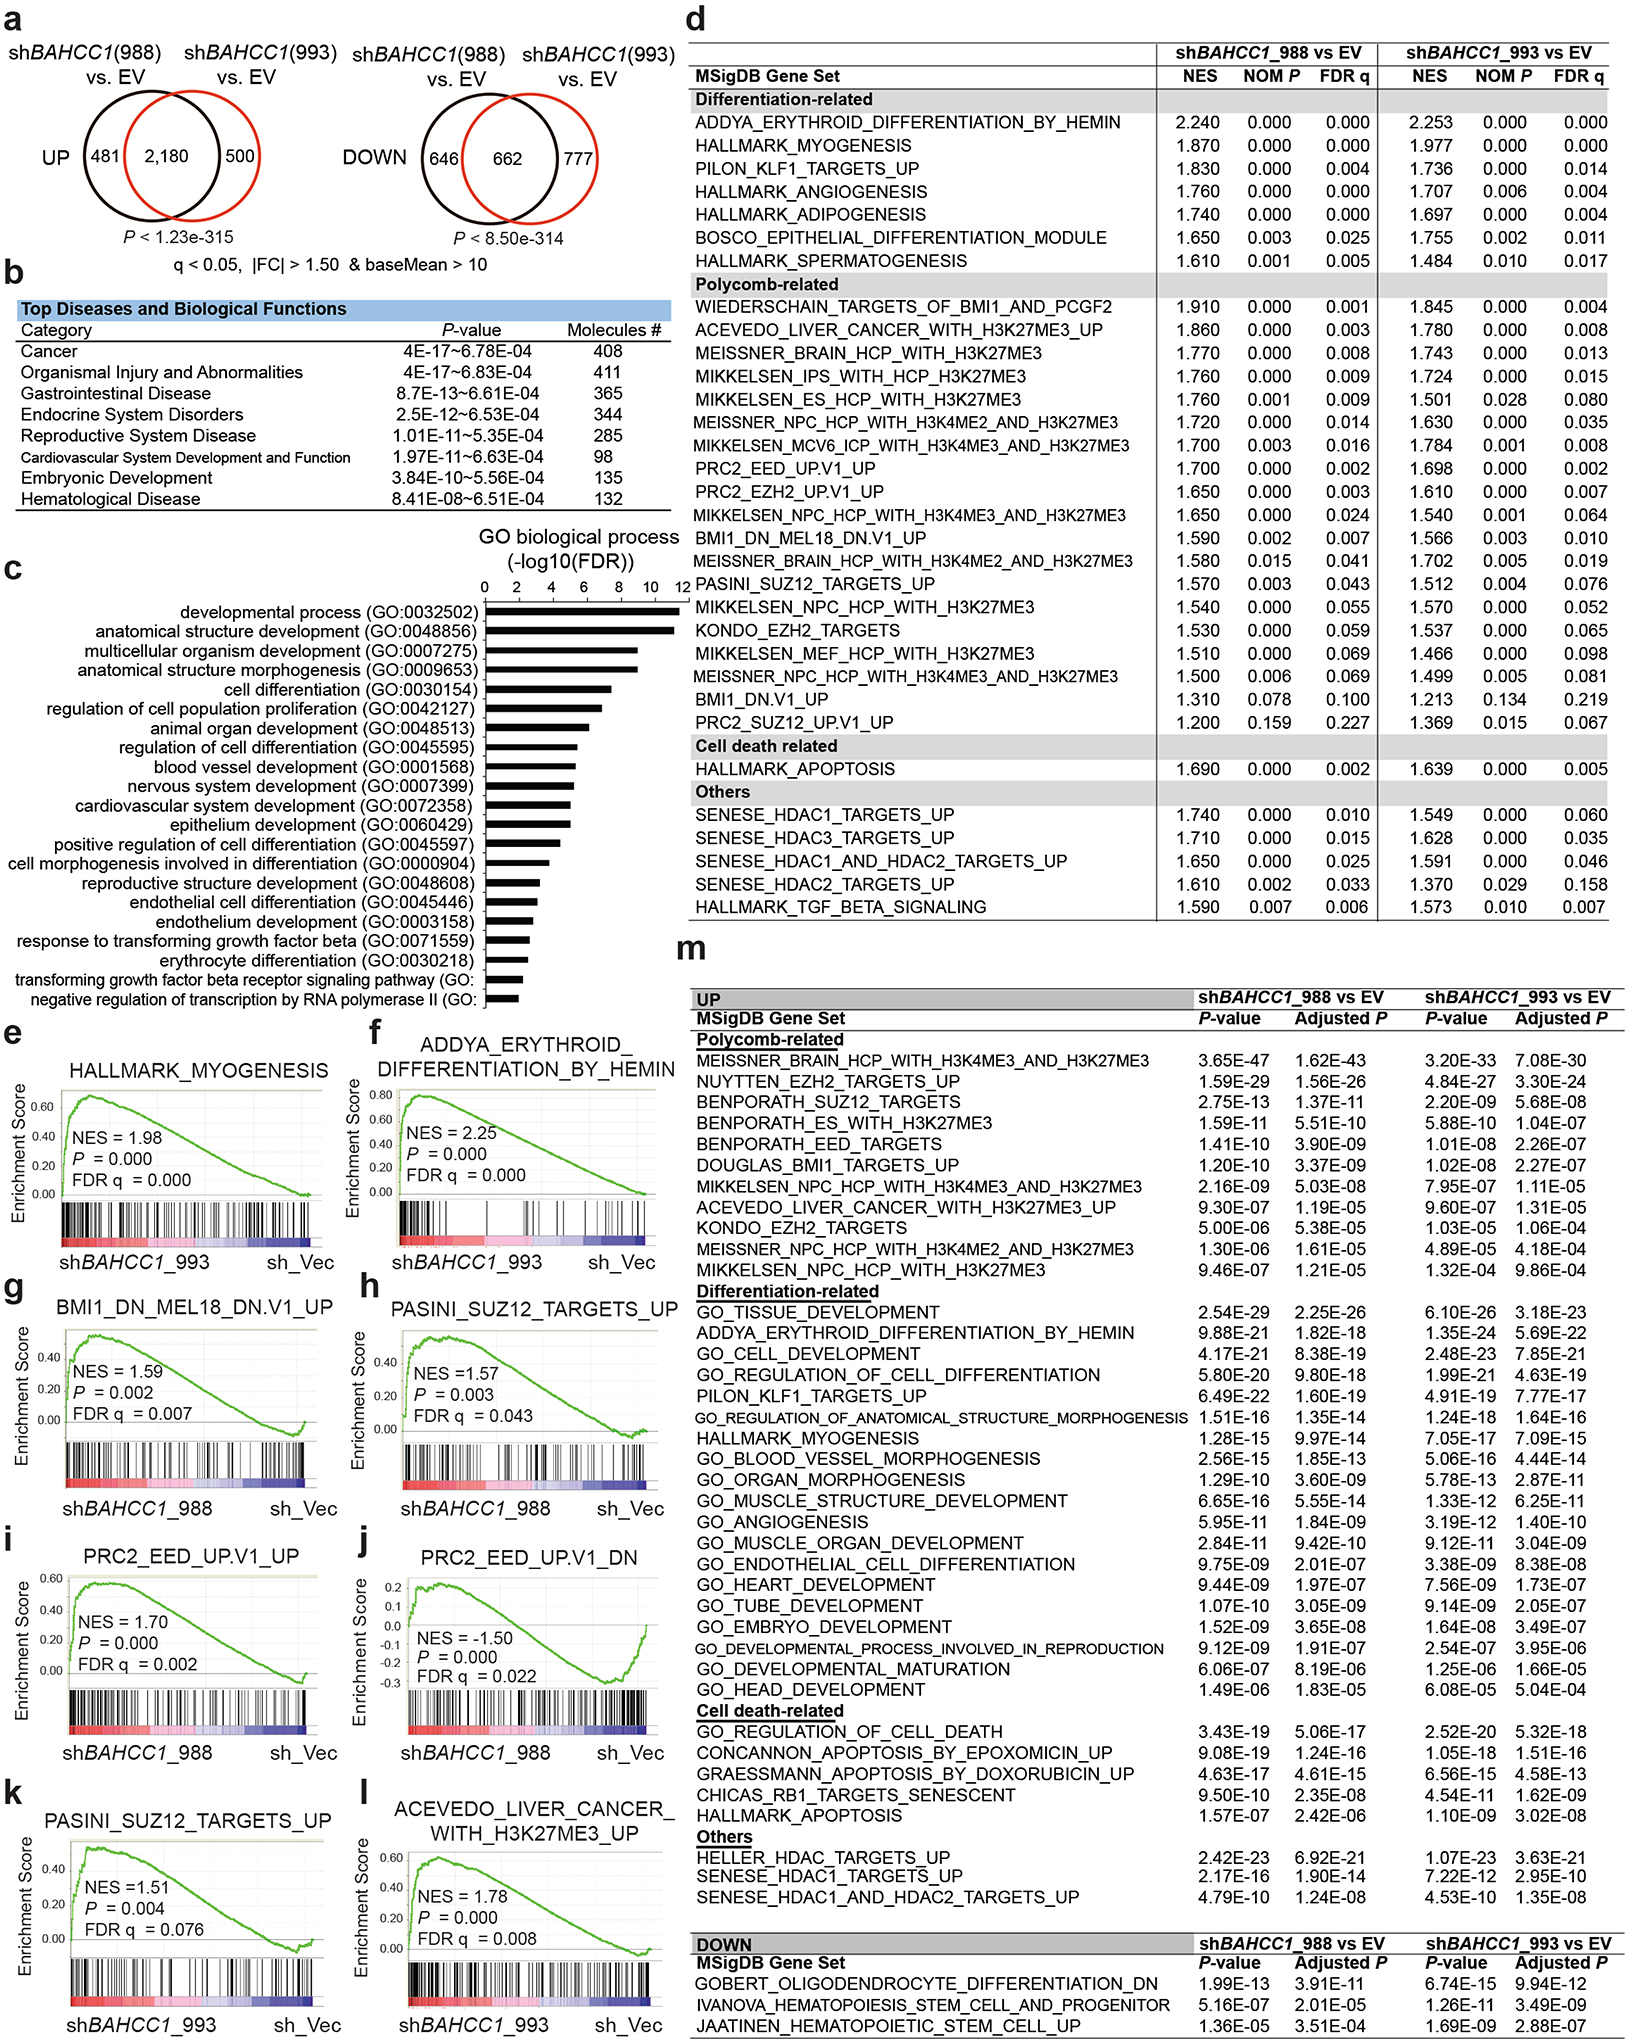
Extended Data Fig. 5|. Transcriptome profiling reveals the gene-expression programs regulated by BAHCC1 in JURKAT cells.

a, Venn diagrams show overlapping for upregulated (left) or downregulated (right) transcripts in JURKAT cells post-transduction of a BAHCC1-targeting shRNA, relative to empty vector-treated control (EV), as revealed by RNA-seq (n=3 biologically independent samples). The threshold for differentially expressed genes (DEGs) is an adjusted p (q) value of less than 0.05 and fold-change (FC) of over 1.50 for transcripts with baseMean value of more than 10.
b-c, Ingenuity Pathway Analysis (IPA; b) and Gene Ontology (GO; c) analyses with the genes found to be commonly upregulated post-KD of BAHCC1 by the two independent shRNAs, relative to mock, in JURKAT cells.
d, Summary of GSEA using RNA-seq profiles of JURKAT cells post-KD of BAHCC1 by sh988 (left) or sh993 (right), relative to EV. Representative genesets are categorized into differentiation, Polycomb (PRC2 and PRC1) or cell death-related or others.
e-f, GSEA demonstrates that BAHCC1 KD is correlated with derepression of genesets associated with myogenesis (e) and erythroid differentiation (f).
g-l, GSEA showing BAHCC1 KD correlated with reactivation of genesets suppressed by PRC1 (g) or PRC2 (h-k) and the H3K27me3-bound genes (l).
m, Platform for Integrative Analysis of Omics data (Piano) analysis results using RNA-seq profiles of JURKAT cells post-KD of BAHCC1 by sh988 (left) or sh993 (right), relative to EV.
