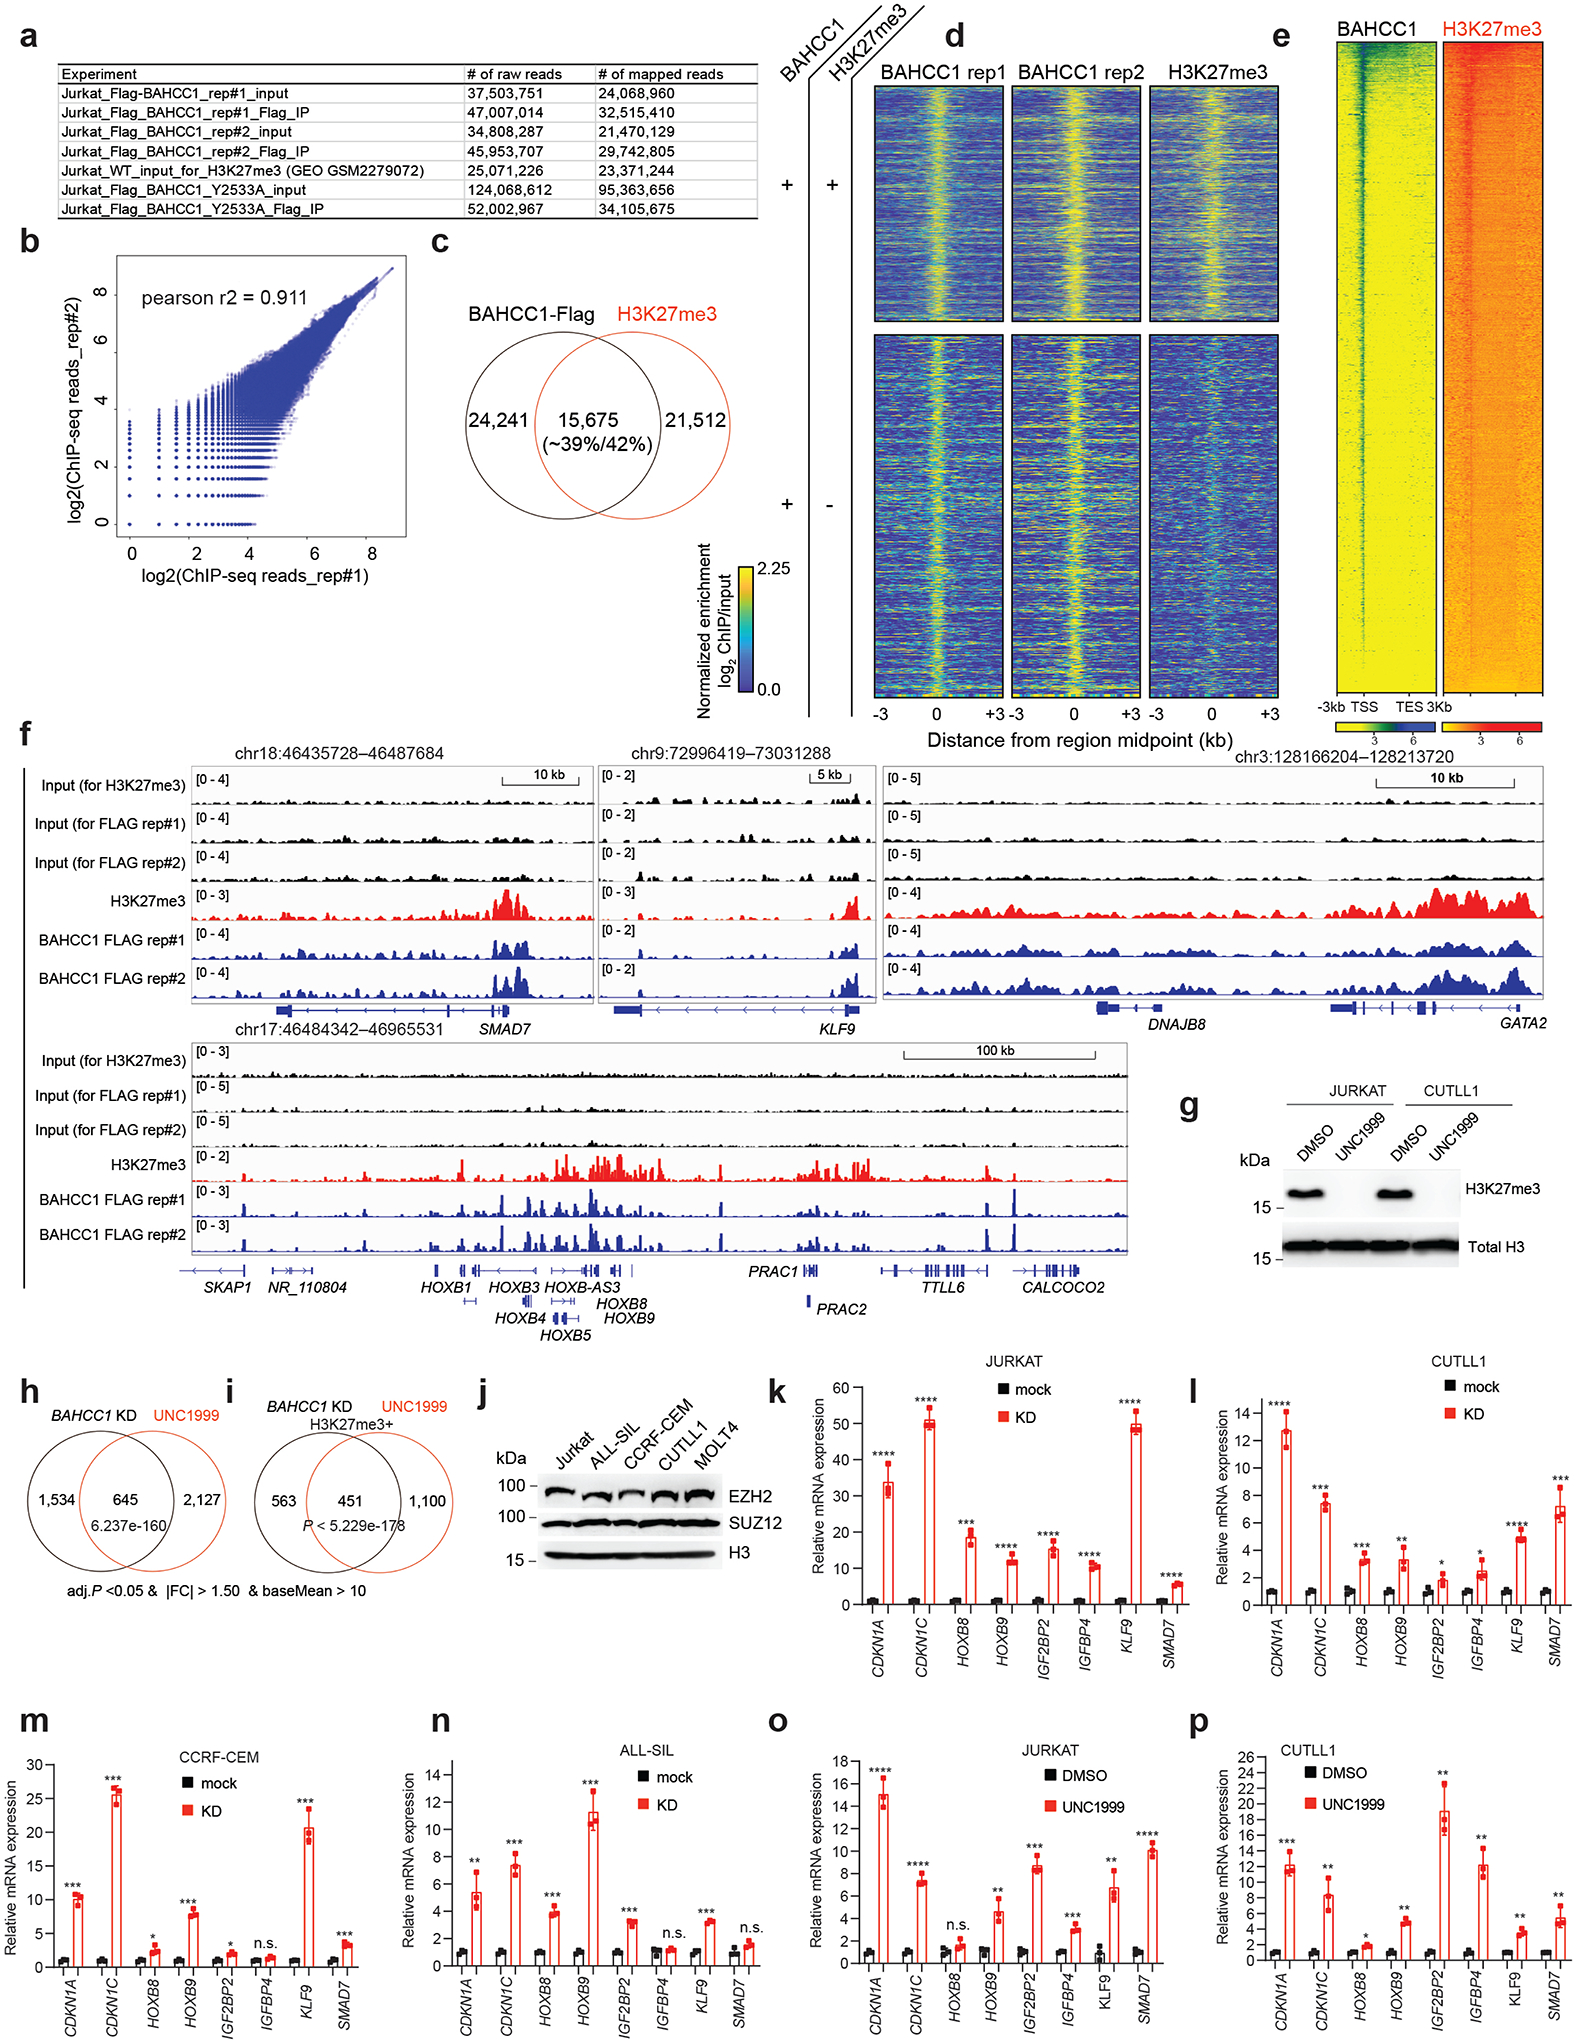
Extended Data Fig. 6|. BAHCC1 co-localizes with H3K27me3, mediating optimal repression of Polycomb target genes in multiple examined leukemia cells.

a, Summary of read counts of Flag ChIP-seq using JURKAT cells carrying 3×Flag-KI-alleles of BAHCC1, either wildtype or Y2533A-mutated.
b, Correlation analysis of replicated Flag-BAHCC1 ChIP-seq data in JURKAT cells.
c, Venn diagram showing overlapping of called BAHCC1 and H3K27me3 peaks in JURKAT cells.
d, Heatmap showing the called BAHCC1 peaks (Flag; two replicated experiments) that overlap (top) or does not overlap (bottom) with H3K27me3 in JURKAT cells after normalization to input and sequencing depth. Color bar, log2(ChIP/Input).
e, Heatmap showing BAHCC1 and H3K27me3 ChIP-seq peaks across ±3 kb from all genes in JURKAT cells. TSS, transcription start site; TES, transcription end site.
f, Flag-tagged BAHCC1 (blue) and H3K27me3 (red) ChIP-seq profile at classic Polycomb/H3K27me3-targeted loci (SMAD7, KLF9, GATA2 and the HOXB cluster) in JURKAT cells.
g, H3K27me3 and H3 immunoblots using JURKAT and CUTLL1 cells post-treatment with UNC1999.
h-i, Venn diagrams show significant overlapping for DEGs, either all DEGs (h) or those directly bound by H3K27me3 (i), that were found upregulated post-KD of BAHCC1 relative to mock (black) or post-treatment with UNC1999 relative to DMSO (red) in JURKAT cells.
j, EZH2, SUZ12 and H3 immunoblotting in various used T-ALL cell lines.
k-n, RT-qPCR of the indicated H3K27me3-targeted gene post-KD of BAHCC1 (red), relative to mock (black), in T-ALL cells including JURKAT (k), CUTLL1 (l), CCRF-CEM (m) and ALL-SIL (n). Data of three independent experiments are plotted as mean ± SD after normalization to GAPDH and to mock-treated cells. *P < 0.05; **P < 0.01; ***P < 0.001; ****P < 0.0001; n.s., not significant.
o-p, RT-qPCR of the indicated H3K27me3-targeted gene after UNC1999 treatment, compared to mock, in JURKAT (o) and CUTLL1 (p) cells. Data of three independent experiments are plotted as mean ± SD after normalization to GAPDH and to mock-treated cells. *P < 0.05; **P < 0.01; ***P < 0.001; ****P < 0.0001; n.s., not significant.
