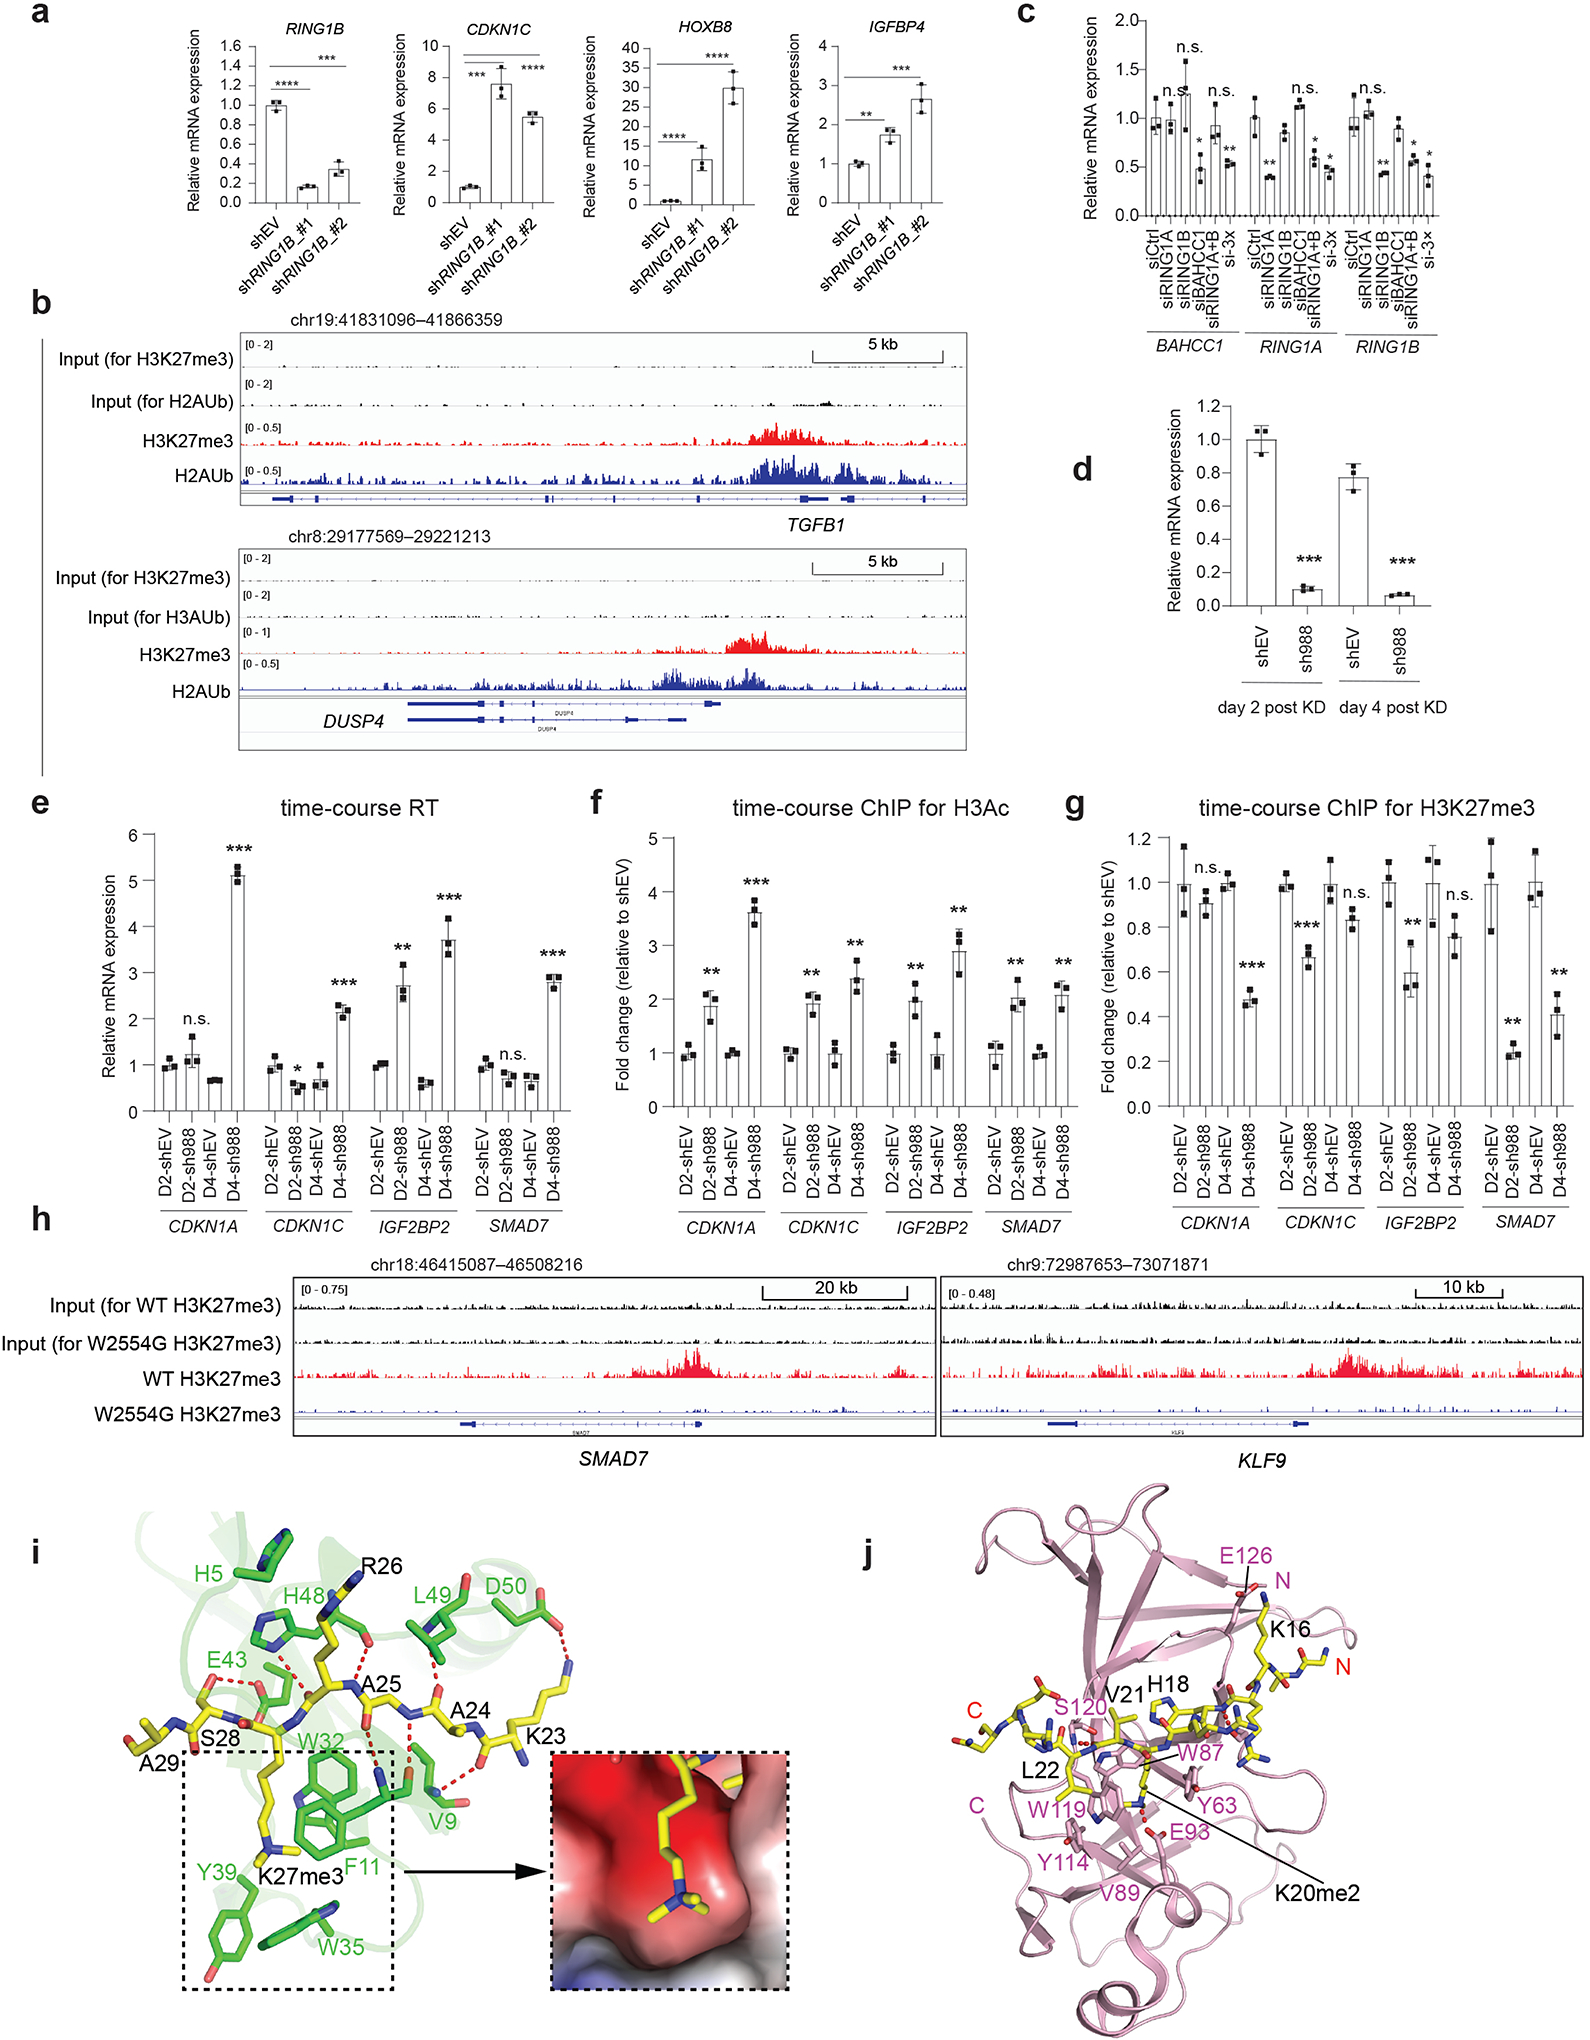
Extended Data Fig. 10|. BAHCC1 and PRC1 corepress H3K27me3-targeted genes in different cell lineages, suggesting a generalized functionality of BAHCC1.

a, RT-qPCR of the indicated gene post-depletion of RING1B by independent shRNAs, relative to mock, in JURKAT cells (n=3 biologically independent samples). Data are presented as mean ± SD. **P < 0.01; ***P < 0.001; ****P < 0.0001.
b, ChIP-seq profiles of H3K27me3 and H2Aub at BAHCC1- and PRC1-corepressed genes in 293 cells.
c, RT-qPCR of BAHCC1, RING1A and RING1B in 293 cells transfected with siRNA of control (siCtrl), RING1A alone (siRING1A), RING1B alone (siRING1B), BAHCC1 alone (siBAHCC1), RING1A plus RING1B (siRING1A+B), or all three genes (si-3×). Data of three independent experiments are plotted as mean ± SD after normalization to GAPDH and to siCtrl-treated. *P < 0.05; **P < 0.01; n.s., not significant.
d-e, RT-qPCR of BAHCC1 (d) and the indicated target gene (e) two and four days (D2 and D4) after BAHCC1 KD (sh988), compared to mock, in 293 cells (n=3 independent experiments). Data are plotted as mean ± SD after normalization to GAPDH and to shEV. *P < 0.05; **P < 0.01; ***P < 0.001; n.s., not significant.
f-g, H3 acetylation (f) and H3K27me3 (g) ChIP-qPCR for the indicated gene promoter at different timepoints after shRNA-mediated BAHCC1 KD in 293 cells (n=3 independent experiments). Data are plotted as mean ± SD after normalization to shEV cells. **P < 0.01; ***P < 0.001; n.s., not significant.
h, H3K27me3 ChIP-seq profile at BAHCC1 targets in JURKAT cells carrying WT or the W2554G homozygous mutation of BAHCC1.
i, Intermolecular interactions between CBX7CD (PDB 4X3K) and H3K27me3 peptide (yellow; left), along with the surface view of the H3K27me3-binding groove (right). The side chains of interacting residues are shown in stick representation and hydrogen bonds in dashed lines.
j, Ribbon representation of ORC1BAH (pink) bound to H4K20me2 peptide (yellow sticks) (PDB 4DOV). The H4K20me2-binding residues of ORC1BAH are labeled. The hydrogen bonding interactions are shown as dashed lines.
