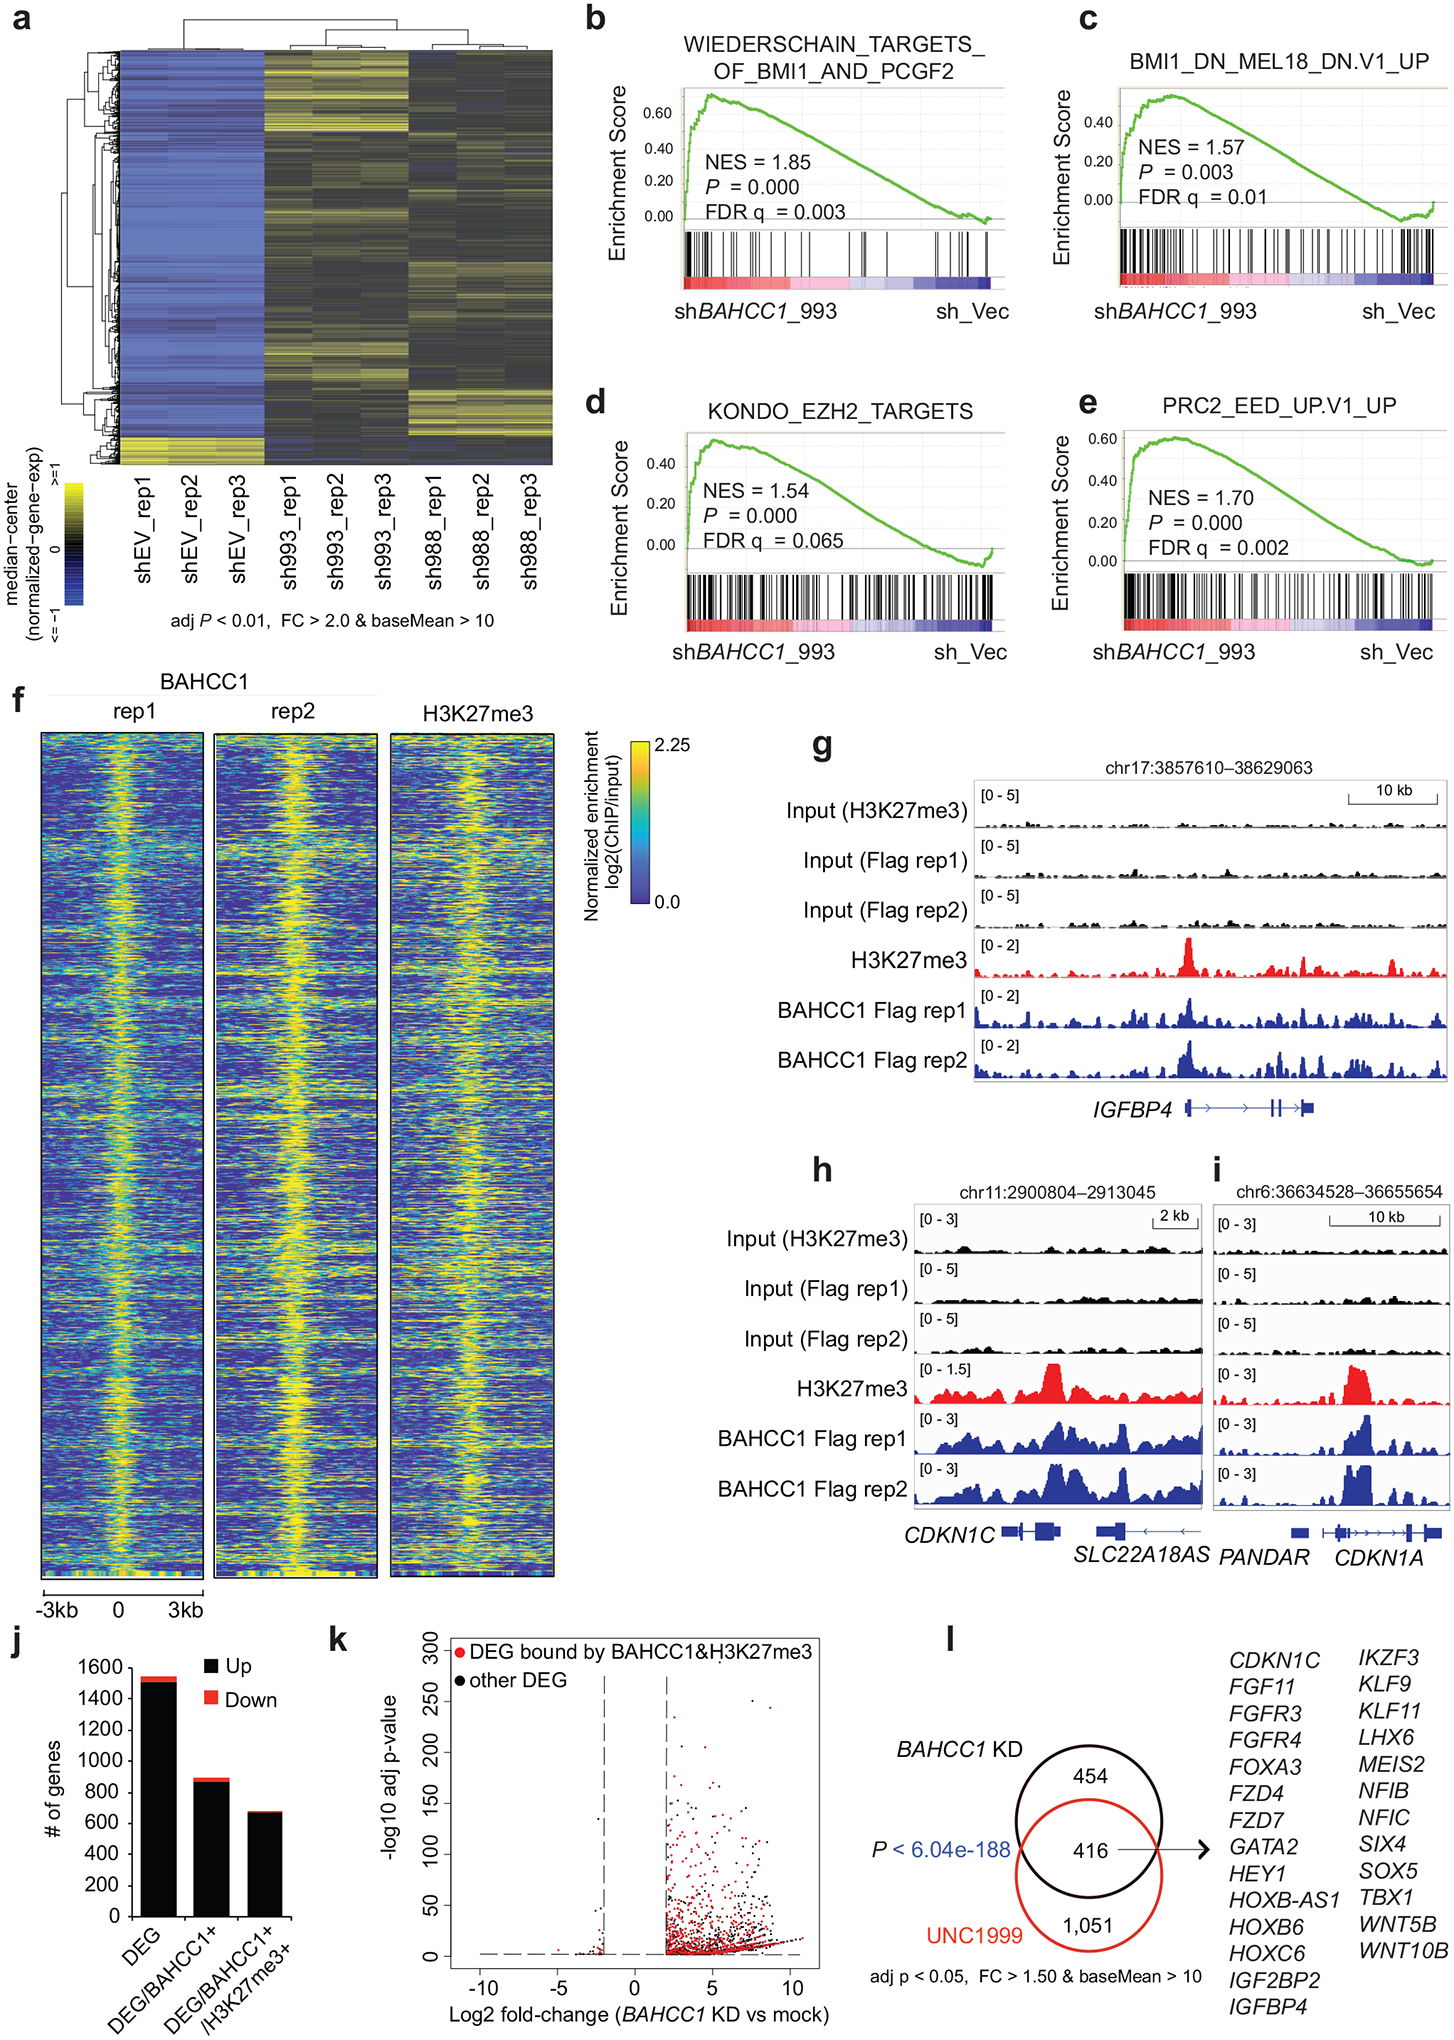
Fig. 4. Integrated RNA-seq and ChIP-seq analyses demonstrate a direct involvement of BAHCC1 in silencing of the H3K27me3-targeted genes.

a, Heatmap showing expression of differentially expressed genes (DEGs) after BAHCC1 KD (sh993 or sh988), relative to mock (shEV), in JURKAT cells (n = 3 biologically independent experiments). The threshold of DEGs is adjusted P value (adj. p) < 0.01, fold-change (FC) > 2.0 and transcript baseMean value > 10 based on RNA-seq. Color bar, log2(FC).
b-e, GSEA revealing positive correlations between BAHCC1 depletion and reactivation of genesets related to PRC1 (b-c) or PRC2 (d-e). NES, normalized enrichment score; FDR, false discovery rate.
f, Heatmap showing ChIP-seq peaks of BAHCC1 (Flag; two replicated experiments) that overlap with H3K27me3 peaks in JURKAT cells after normalization to input and sequencing depth. Color bar, log2(ChIP/Input).
g-i, ChIP-seq profiles of BAHCC1 (blue; Flag) and H3K27me3 (red) at IGFBP4 (g), CDKN1C (h) and CDKN1A (i) in JURKAT cells.
j, Summary of the total number of DEGs (a cutoff of q < 0.01 and log2|FC| > 2), either up- (black) or down-regulated (red) after BAHCC1 depletion relative to mock, as detected by RNA-seq in JURKAT cells. DEGs are either all detected (left) or those with direct binding of BAHCC1 (middle) or both BAHCC1 and H3K27me3 (right), based on the called ChIP-seq peaks.
k, Volcano plot of DEGs, including those directly bound by both BAHCC1 and H3K27me3 (red) and the rest (black), as detected by RNA-seq in JURKAT cells after BAHCC1 KD, compared to control.
l, Venn diagram illustrating overlap for those BAHCC1 and H3K27me3 co-bound DEGs found to be upregulated after BAHCC1 depletion (black) or UNC1999 treatment (red), relative to mock, in JURKAT cells. Right panel lists the well-defined Polycomb targets commonly affected by both treatment conditions.
