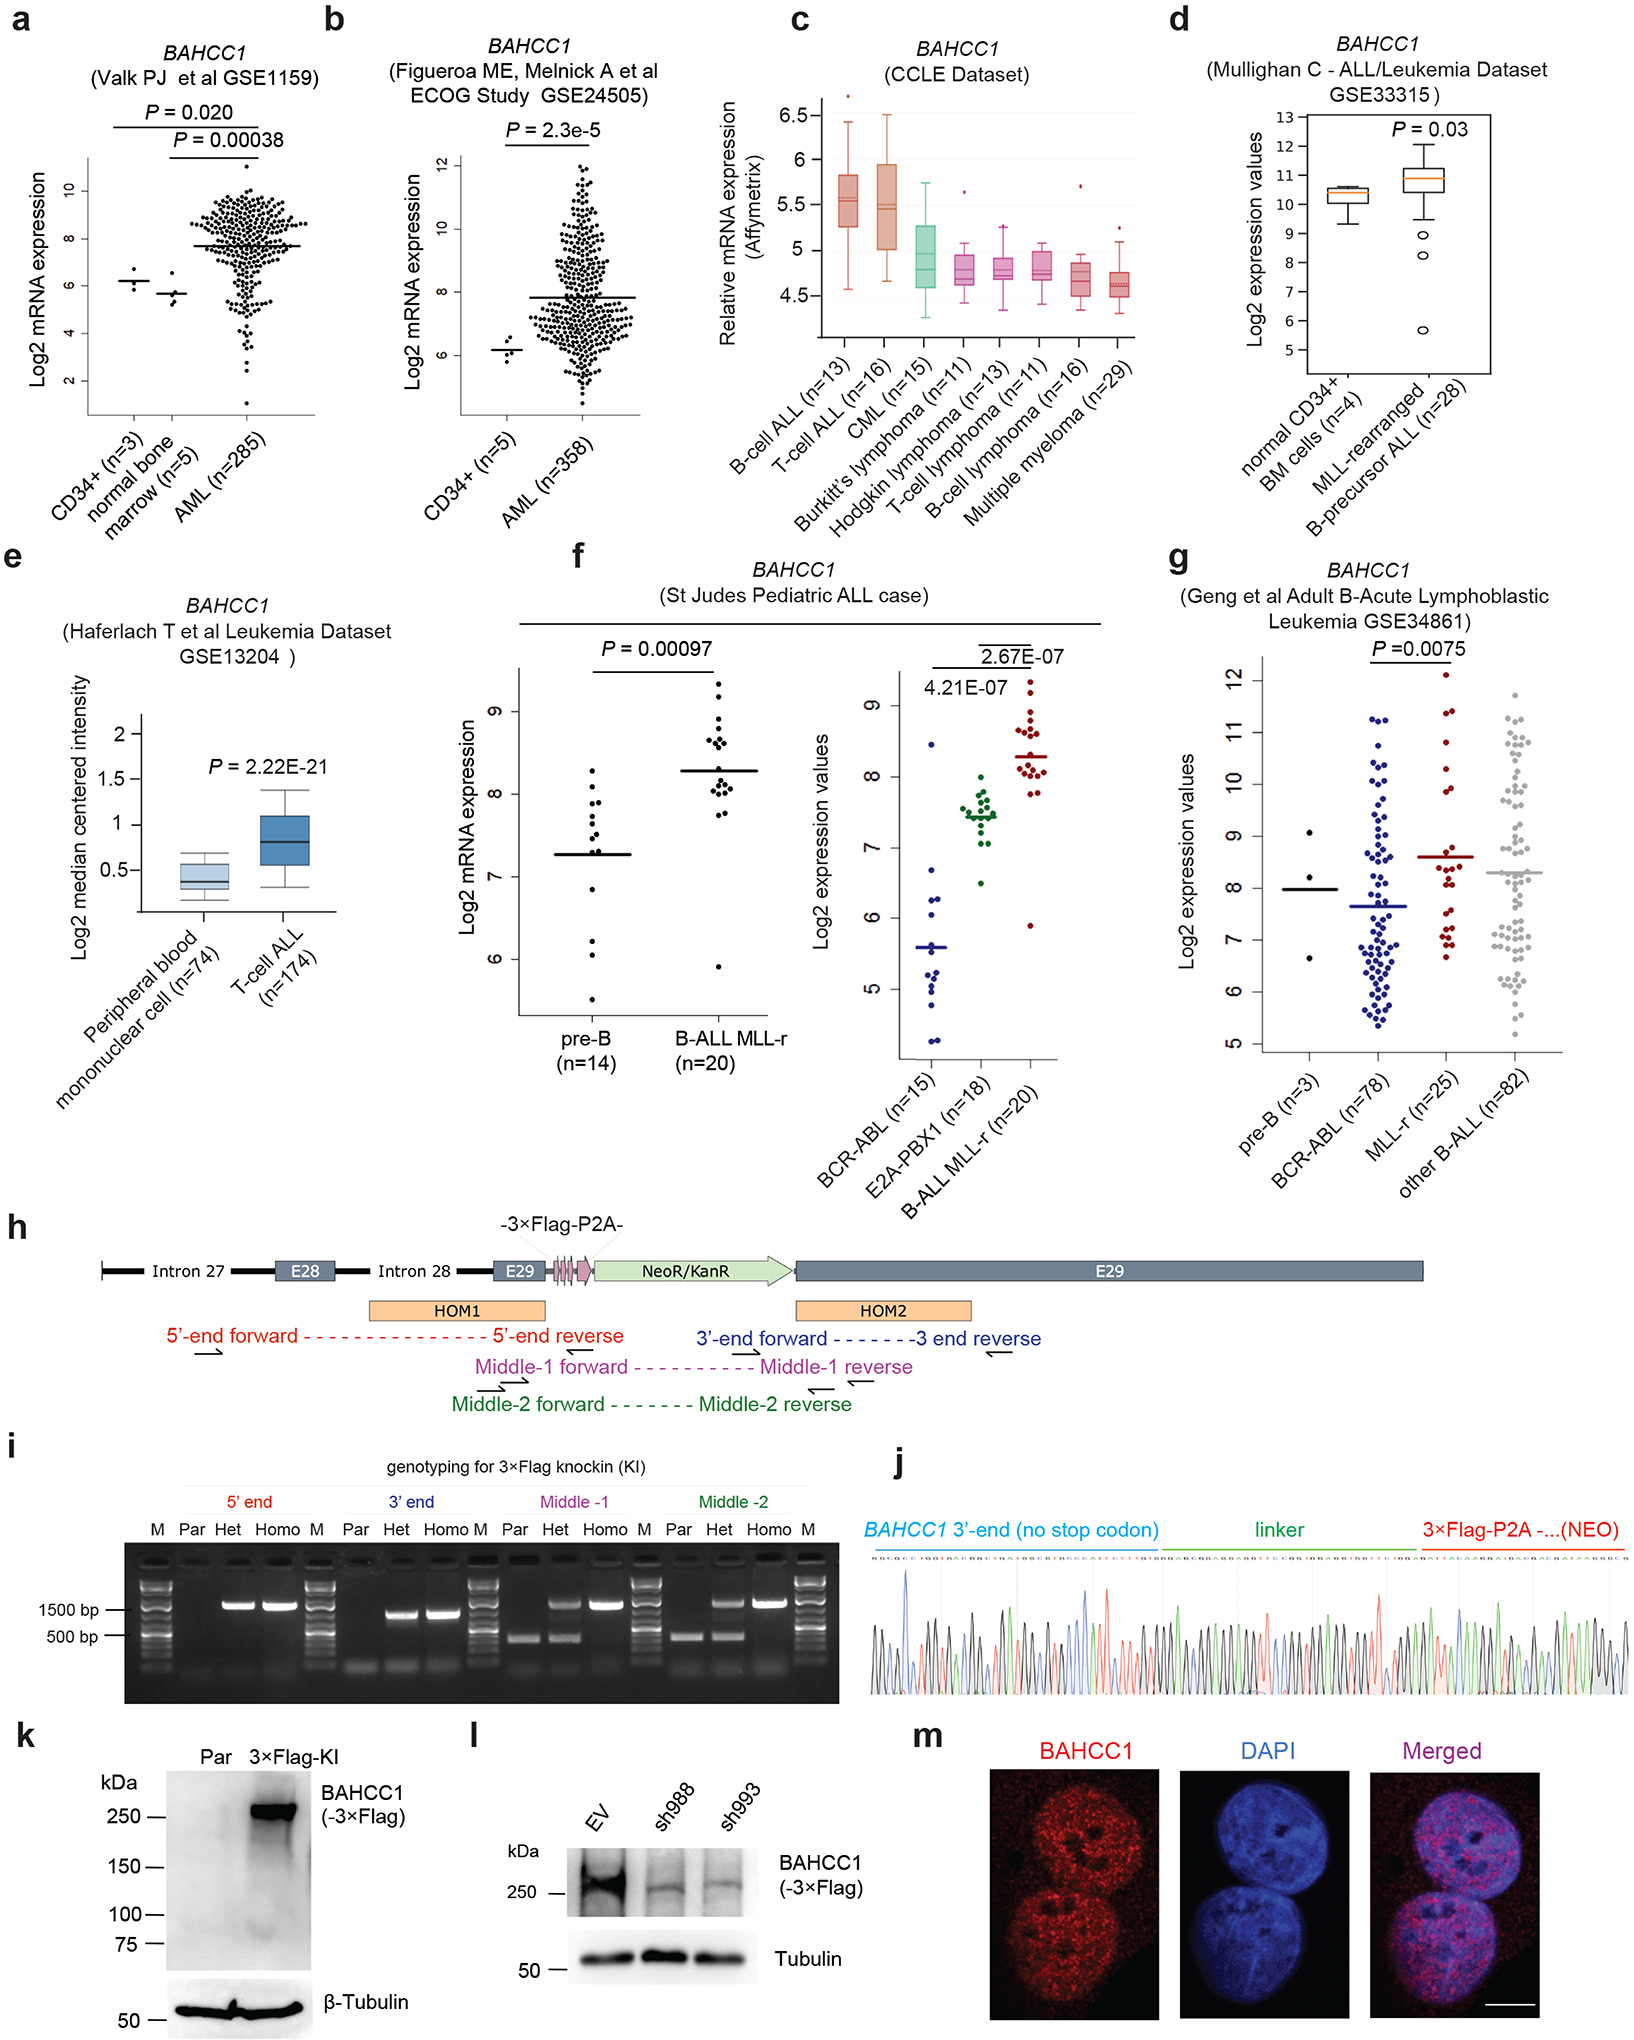
Extended Data Fig. 1|. BAHCC1, a nuclear factor of unknown function, shows overexpression among acute leukemias.

a-g, Boxplots showing BAHCC1 expression among primary AMLs (based on GEO dataset GSE115959 in panel a and GSE24505 in b), hematological cancer lines according to Cancer Cell Line Encyclopedia dataset (c), and primary ALLs carrying genetic abnormality such as MLL rearrangement (MLL-r), BCR-ABL or E2A-PBX1 according to GEO datasets GSE33315 (d) and GSE13204 (e), the St Jude Hospital “Pediatric Acute Lymphoblastic Leukemia” cohort (f) or GSE34861 (g), relative to the indicated normal controls. The line indicates the mean and two-sided Wilcoxon test was used for calculating P value denoted on top of the panel. n, sample size.
h-i, Schematic diagram (h) and PCR genotyping (i) of Flag Epitope Tag ChIP (pFETCh)-based strategy utilized to introduce a 3×Flag-P2A-NeoR+ cassette in-frame into the C-terminus of endogenous BAHCC1 gene. HOM1/2 (h), homology arm 1/2; E28/29, exons 28/29 of BAHCC1. Genotyping primers used for validating the cassette knockin are denoted in different colors. Agarose gel image (i) shows DNA ladder (M) and genotyping products using the indicated primers and genomic DNA of parental (Par) cells or those carrying heterozygous (Het) or homozygous (Homo) BAHCC1-3×Flag knockin (KI) alleles.
j, Representative Sanger sequencing results showing correct recombination and cassette knockin in the produced JURKAT cells carrying homozygous BAHCC1-3×Flag KI alleles.
k-l, Anti-Flag immunoblotting for endogenous BAHCC1–3×Flag protein, which was detected as ∼300kD in size (k) and readily depleted by BAHCC1-targeting shRNAs (sh988 or sh993; l), in JURKAT cells carrying the BAHCC1-3×Flag KI alleles. Parental (par) cells and those transduced with empty vector (EV) were used as control.
m, Representative images of confocal immunofluorescence reveal the exclusive nuclear localization of endogenous BAHCC1 (left), relative to DNA staining (middle), in HeLa cells. Scale bar, 5 μm.
