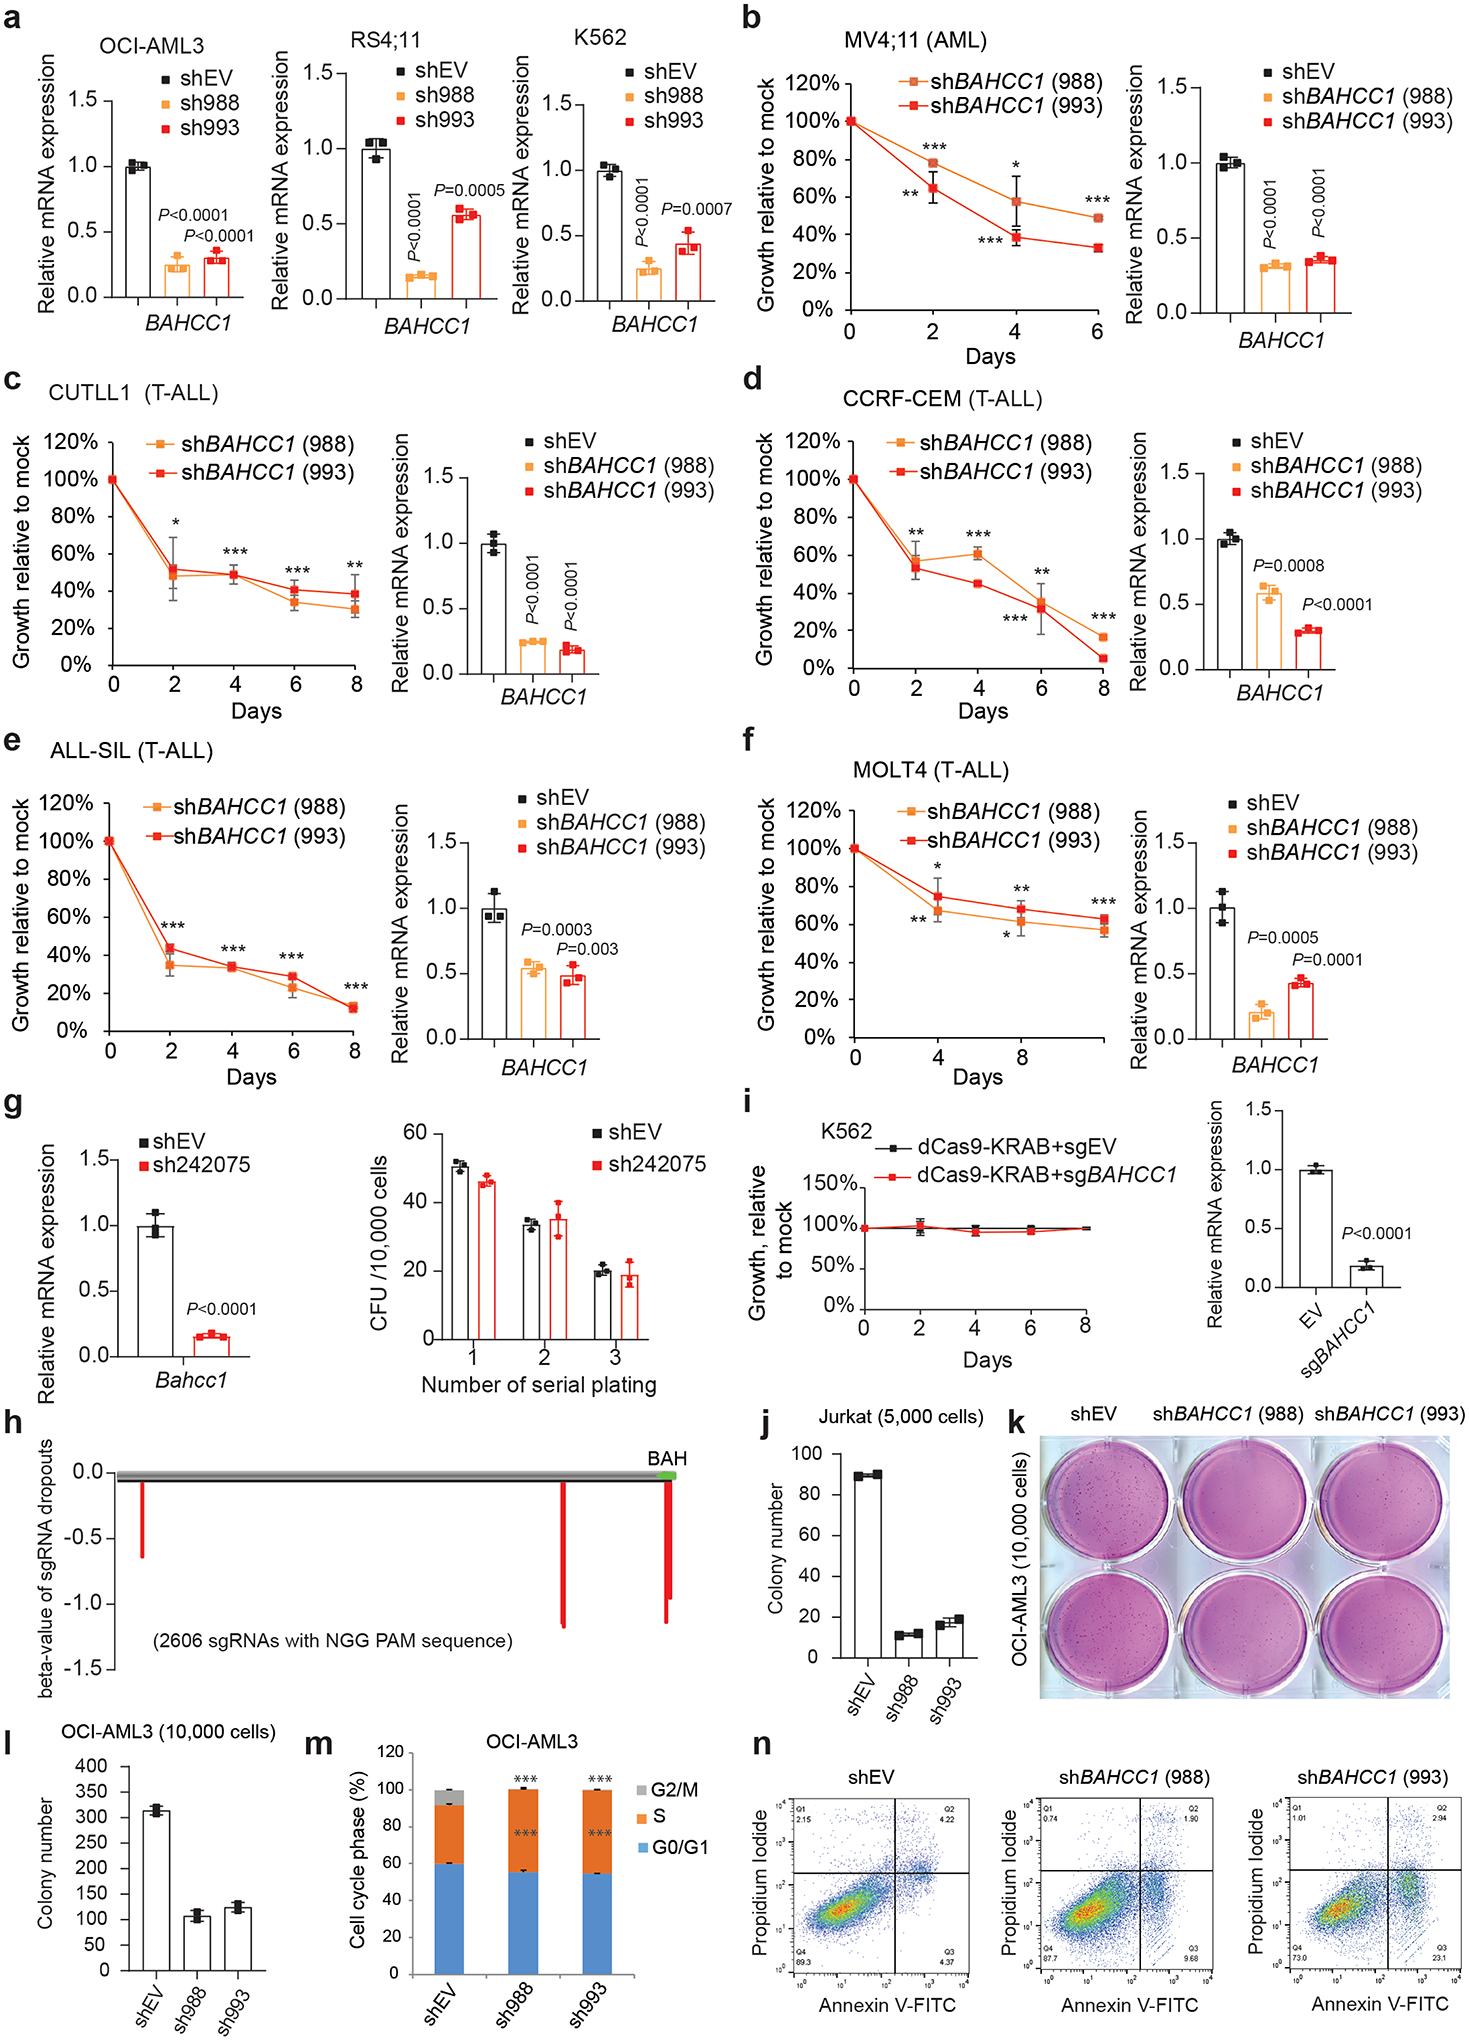
Extended Data Fig. 2|. BAHCC1 promotes the in vitro growth, colony formation and cell cycle progression of acute leukemia cells.

a, RT-qPCR validating shRNA-mediated BAHCC1 knockdown (KD; with independent hairpins sh988 and sh993) in OCI-AML3, RS4;11 and K562 cells (n=3 biologically independent samples). Data are presented as mean ± SD.
b-f, Proliferation (left) after BAHCC1 KD (RT-qPCR shown in the right panel), relative to empty vector (shEV)-treated control, in acute leukemia lines, including AML (MV4;11, b) and T-ALL (CUTLL1, CCRF-CEM, ALL-SIL and MOLT4; c-f). n=3 biologically independent experiments. Data are presented as mean ± SD.
g, RT-qPCR of Bahcc1 (left) and summary of colony-forming unit (CFU) assay (right) post-KD of Bahcc1 (sh242075), relative to shEV, in mouse primary HSPCs (n=3 biologically independent experiments). Data are presented as mean ± SD.
h, Dropout plot suggests that BAHCC1 regions targeted by the indicated sgRNAs are potentially crucial for JURKAT cell growth. Plotted at the bottom are sgRNAs showing significant dropout 10 days post-transduction of a viral BAHCC1 sgRNA pool, compared to day 1, among the same infected cells. Y-axis represents dropout beta-value, produced by the “Model-based Analysis of Genome-wide CRISPR-Cas9 Knockout” module, with a cutoff of P value < 0.08.
i, K562 cell proliferation (left) after dCas9-KRAB-mediated repression of BAHCC1 (RT-qPCR shown on the right; n=3 biologically independent experiments).
j, Quantification of colonies formed by JURKAT cells post-KD of BAHCC1 compared to mock (n=2 biologically independent experiments). Data are presented as mean ± SD.
k-l, Representative plate scan images (k) and quantification of colony formation (l) using OCI-AML3 cells post-KD of BAHCC1 relative to mock (n=2 biologically independent experiments).
m, Cell cycle phase quantification using OCI-AML3 cells post-KD of BAHCC1 relative to mock (n=3 biologically independent experiments). ***, P < 0.001. Data are presented as mean ± SD.
n, Measurement of apoptosis in JURKAT cells post-KD of BAHCC1 relative to mock.
