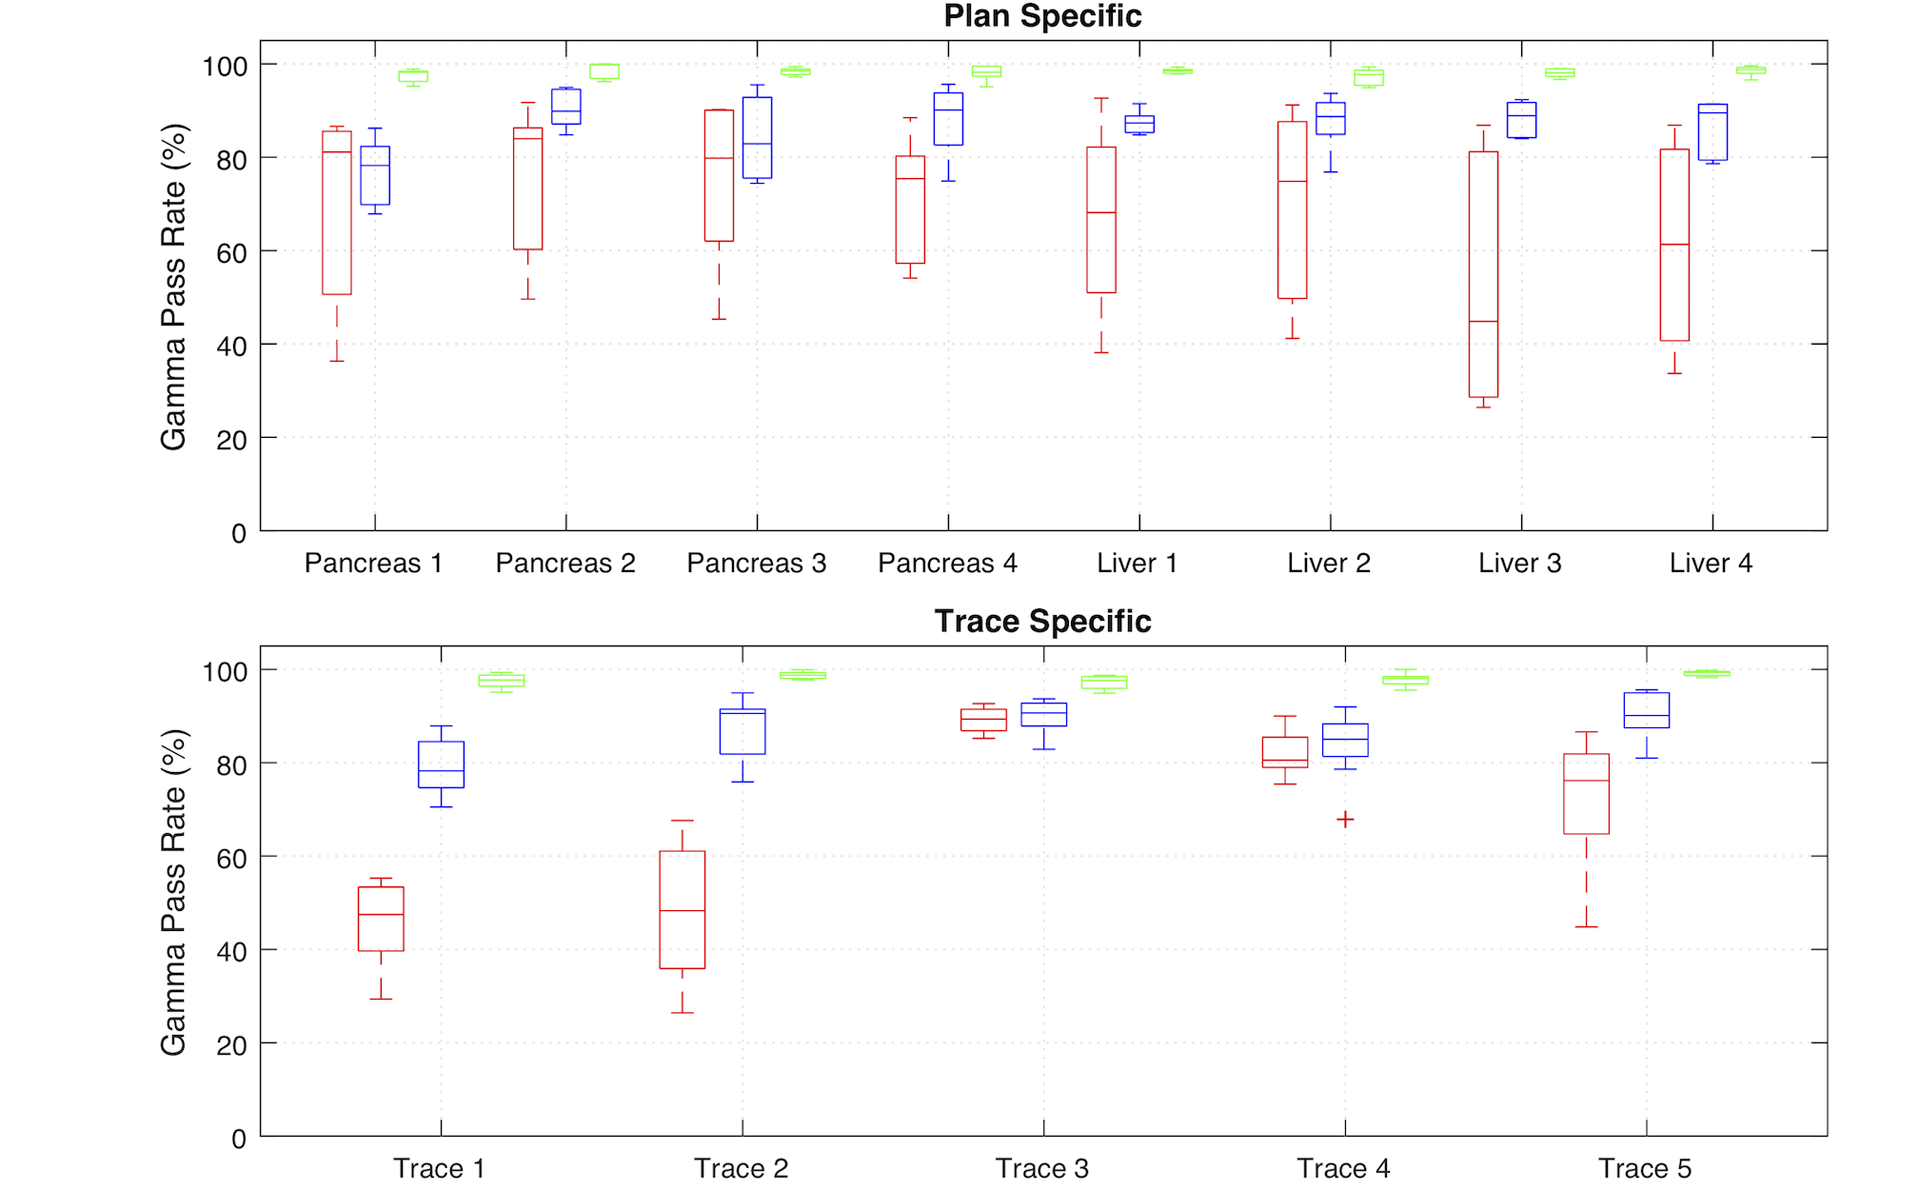
Figure 11:

Plan specific (top) and motion trace specific (bottom) comparison of 2%/2mm gamma pass rate for deliveries without tracking, with MLC tracking, and with couch tracking. Results of each modality is shown as median and 25th and 75th percentiles, as well as the range of all data points. Data points outside ± 3 standard deviation were shown as outliers.
