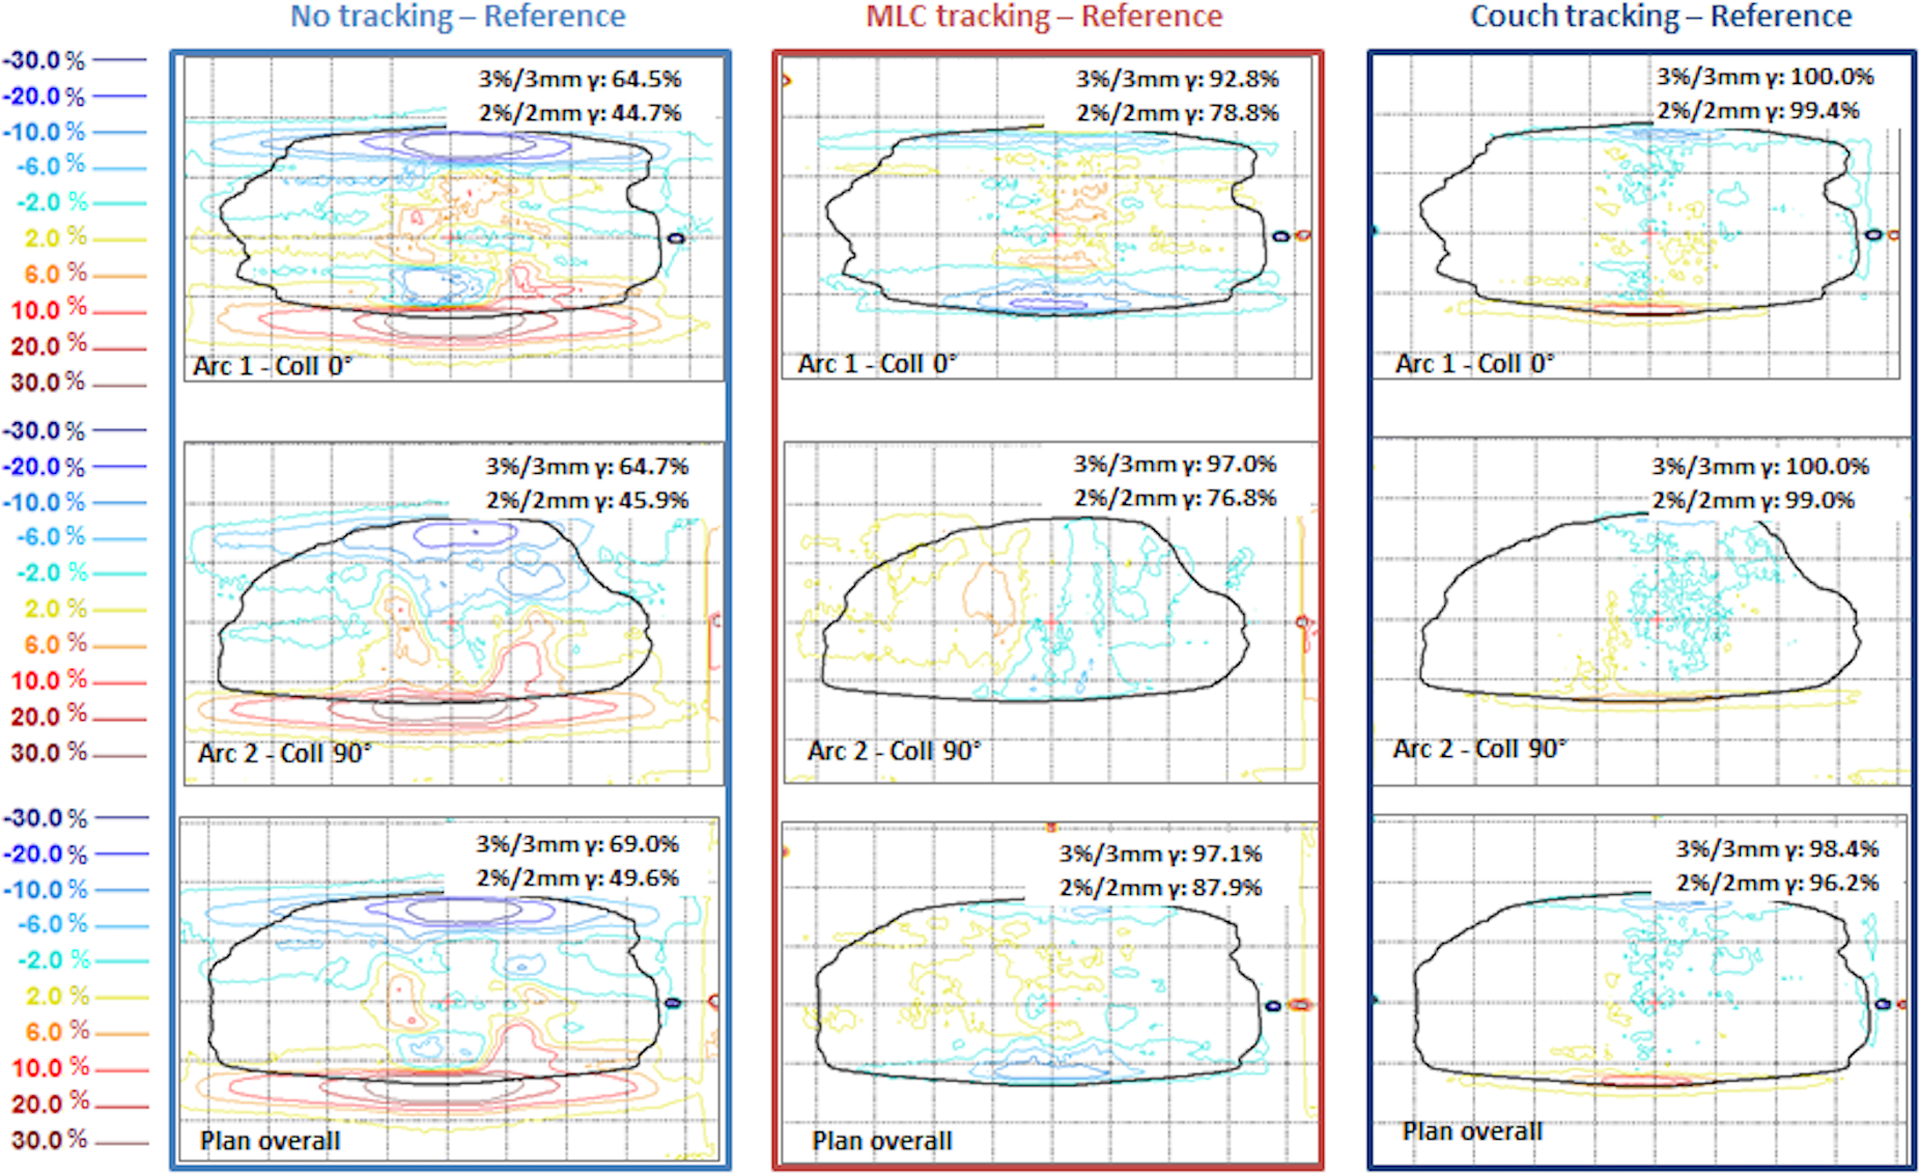
Figure 13:

Dose difference maps from pancreas plan 2 and patient trace 1, a single prescription dose level SBRT plan for pancreas. Reference dose refers to the delivery without target motion. Results are shown in percentage dose difference relative to the dose maximum on the plane. Solid black line indicates the ROI defined as 20% of maximum dose.
