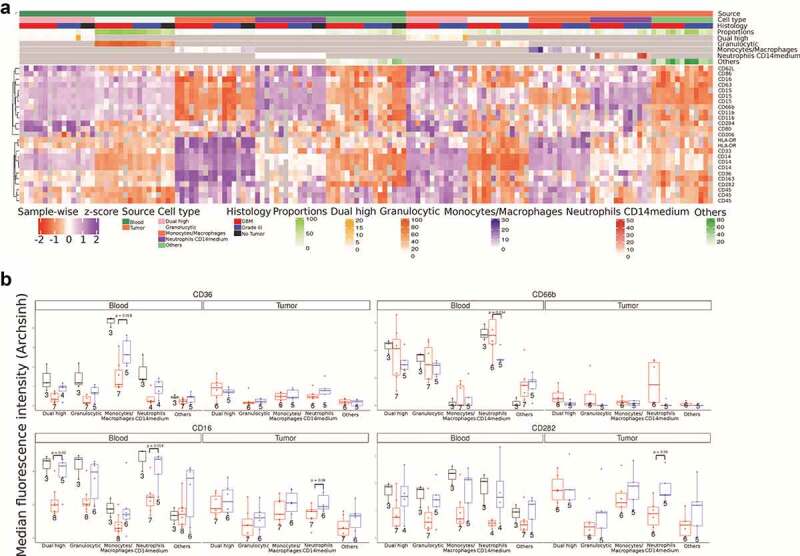
Figure 2.

Clustering analysis of flow cytometry data
a Heatmap showing median fluorescence intensity (MFI) for all markers in five cell types in blood and tumor across No Tumor, GBM and Grade 3 IDHmutant subgroups. For comparison across different samples and batches the MFI values were z-scored sample-wise. CD14, CD15, and CD45 occur three times as they are common markers across all panels.b Box plots of four specific markers, CD36, CD16, CD66b, and CD282, across five cell types in blood and tumor tissue. The Welch’s two sample t-test was used to calculate p values.
