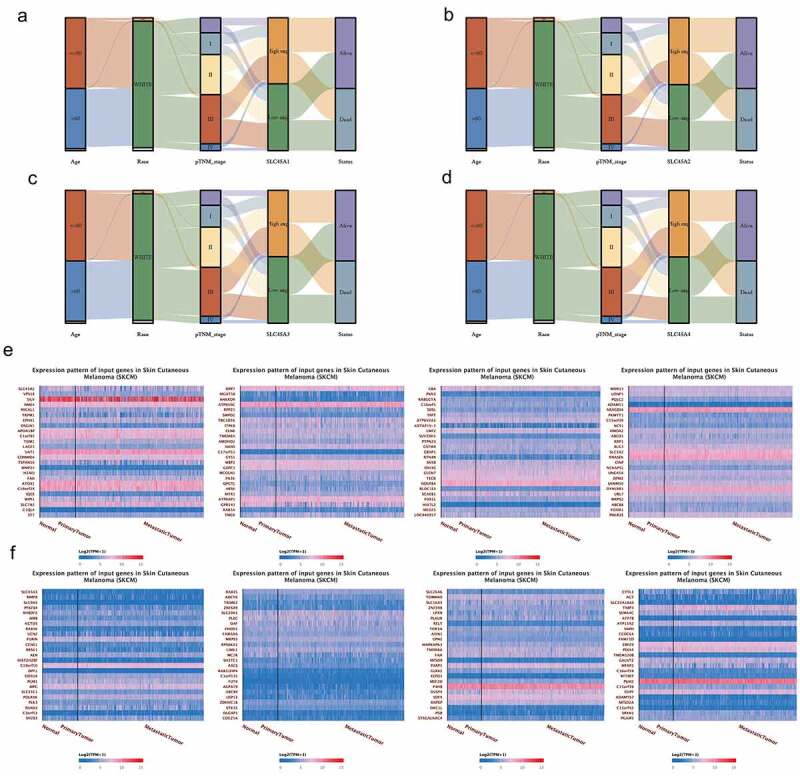
Figure 3.

(a-d). Clinical characteristic association of SLC45 family in melanoma:Each column represents a characteristic variable, different colors represent different types or stages, and lines represent the distribution of the same sample in different characteristic variables. (e). The heat map of the top 100 co-expressed genes with SLC45A2. (d). The heat map of the top 100 co-expressed genes with SLC45A3
