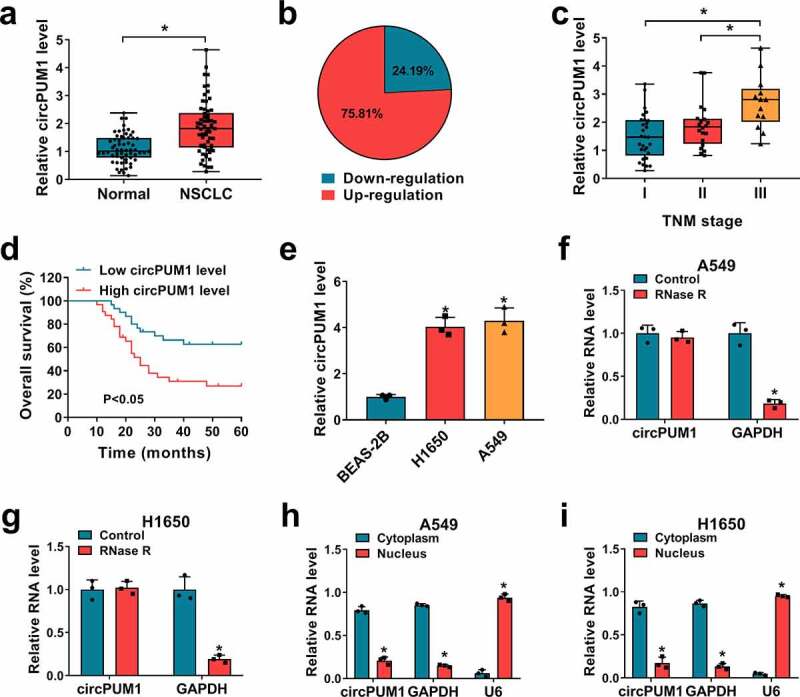
Figure 1.

The expression profile of circPUM1 in NSCLC. (a, b) qRT-PCR analysis of circPUM1 expression in NSCLC tissues and para-carcinoma tissues. (c) qRT-PCR analysis of circPUM1 expression in NSCLC tissues according to TNM staging. (d) Kaplan-Meier overall survival curves for 62 patients with NSCLC classified according to relative circPUM1 expression level. (e) qRT-PCR analysis of circPUM1 expression in two NSCLC cell lines (H1650 and A549) and non-cancerous lung cell line BEAS-2B. (f, g) qRT-PCR analysis of circPUM1 expression in H1650 and A549 cells treated with or without RNsae R. (h, i) qRT-PCR indicating the distribution of circPUM1, GAPDH, and U6 in the cytoplasmic and nuclear fractions of H1650 and A549 cells. *P < 0.05
