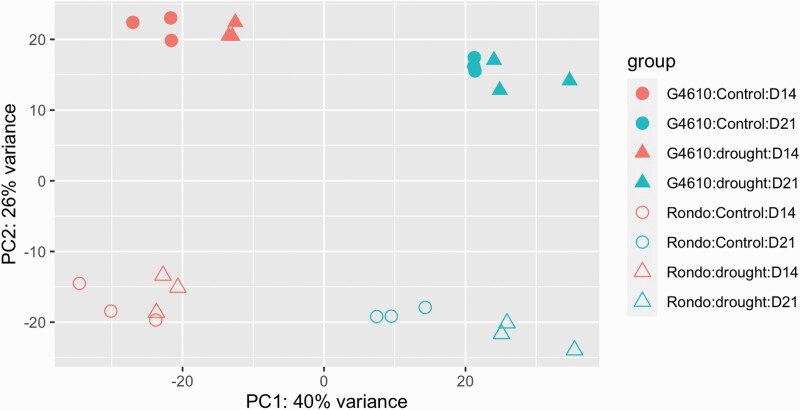
Figure 1.
Principal component analysis (PCA) of RNA-seq samples. The colour differences indicate the different time of sampling; the shape differences indicate the irrigated control (circles) and drought treatment (triangles) groups; solid shapes indicate ‘4610’ and hollow shapes indicate Rondo, as depicted in the figure legend on the right.

