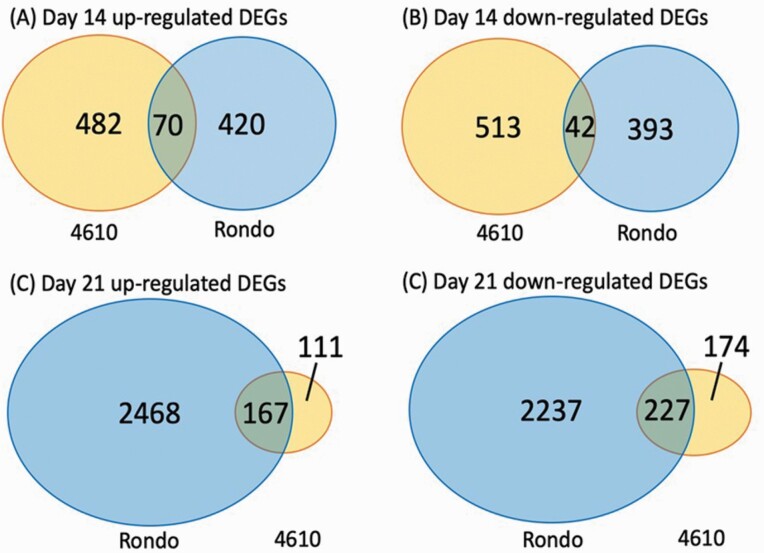
Figure 2.
Venn diagrams of DEGs between the moderate-tolerant genotype ‘4610’ and the susceptible genotype Rondo. (A) Upregulated DEGs at 14 days after drought treatment. (B) Downregulated DEGs at 14 days after drought treatment. (C) Upregulated DEGs at 21 days after drought treatment. (D) Downregulated DEGs at 21 days after drought treatment.

