
Fig. 6. DksA regulates rpoS and ospC expression.
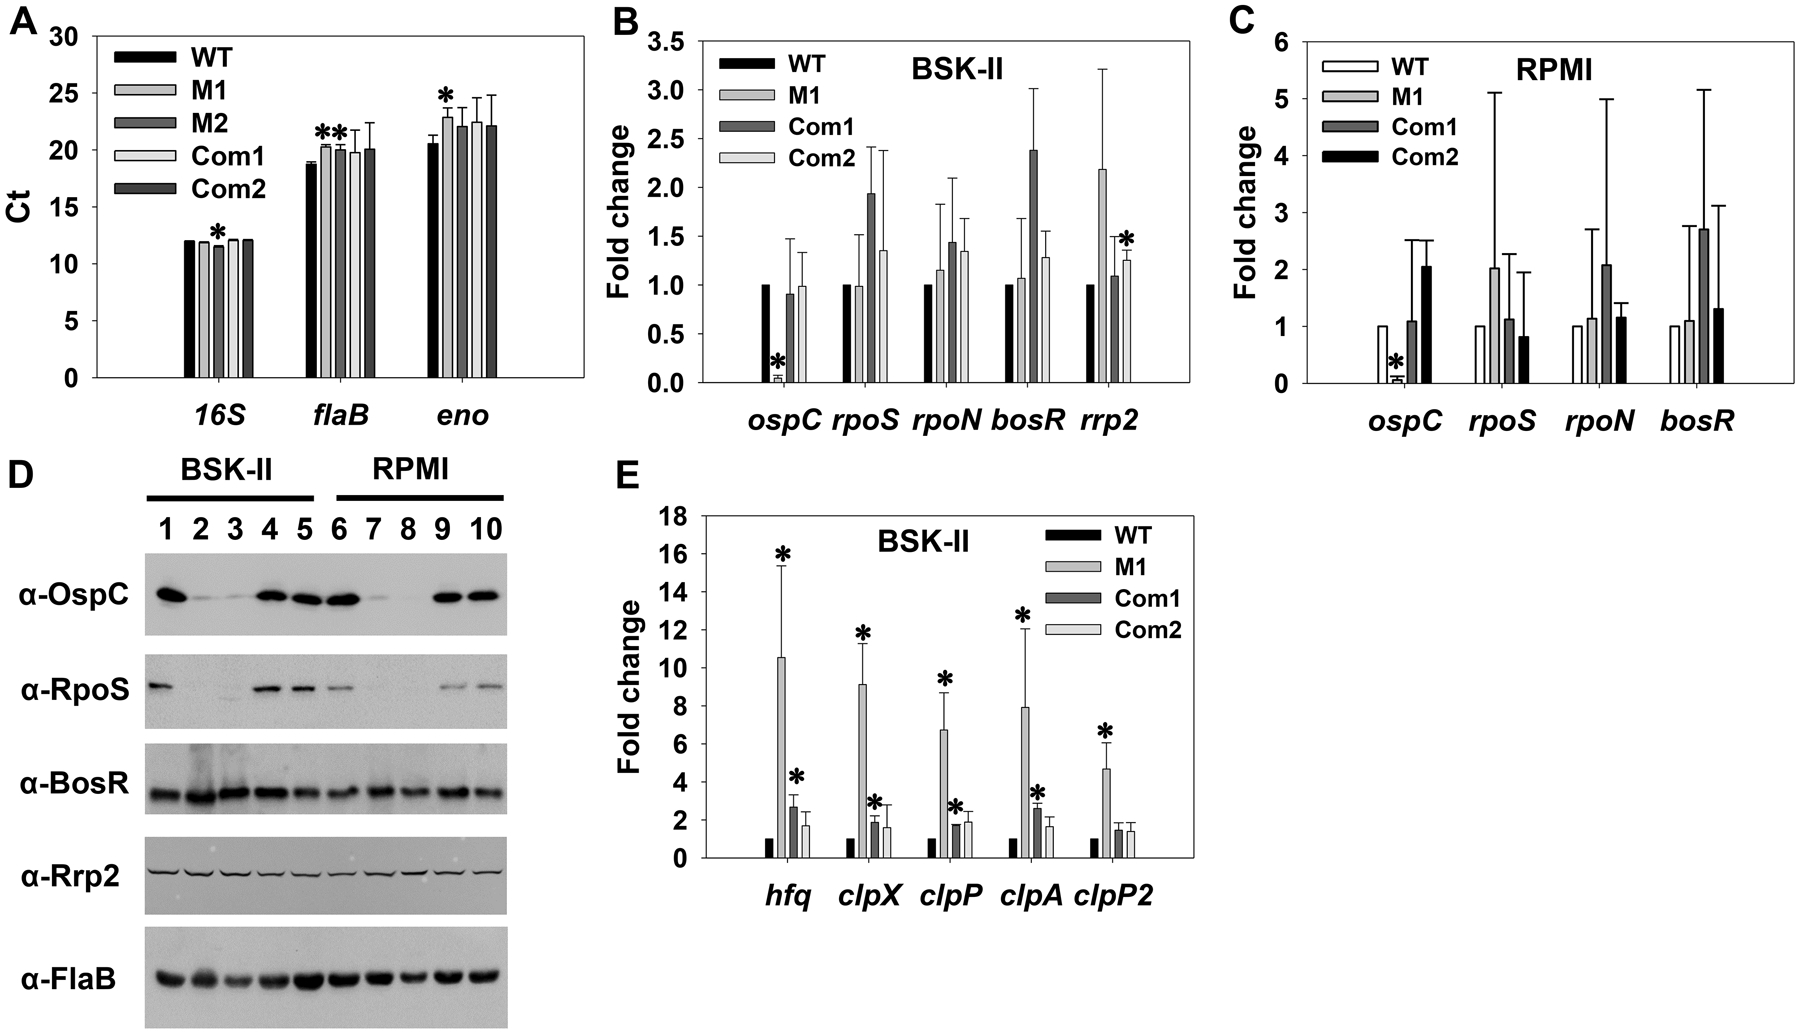
B. burgdorferi was cultivated in BSK-II and spirochetes were collected at stationary phase. In addition, spirochetes were starved in RPMI for 6 h. Gene expression was assessed via qRT-PCR (A, B, C, E) or immunoblot (D). (A) comparison of Ct values (threshold cycle) for reference genes. Gene expression was analyzed using qRT-PCR. Data were obtained from three biological replicates and presented as the mean measurements ± standard deviations. The asterisk indicates statistical significance (P < 0.05) from WT CE162. In (B, C, E), data were normalized using 16S rRNA as an internal control. Bars represent the mean measurements ± standard deviations from three biological replicates. The asterisk indicates statistical significance (P < 0.05) from the WT strain. WT, CE162; M1 and M2, two representative clones of the mutant; Com1, the complemented strain OY463; Com2, the complemented strain OY479. In (D), approximately 4 × 10⁷ spirochetes were loaded onto each lane of a 12.5% SDS-polyacrylamide gel. After proteins were resolved by SDS-PAGE, they were transferred to nitrocellulose membranes and analyzed by immunoblot. Specific antibodies, denoted as α, are indicated on the left. Lanes 1 and 6, WT CE162; lanes 2 and 7, M1 clone of the mutant OY413; lanes 3 and 8, M2 clone of the mutant; lanes 4 and 9, the complemented strain OY463; lanes 5 and 10, the complemented strain OY479.