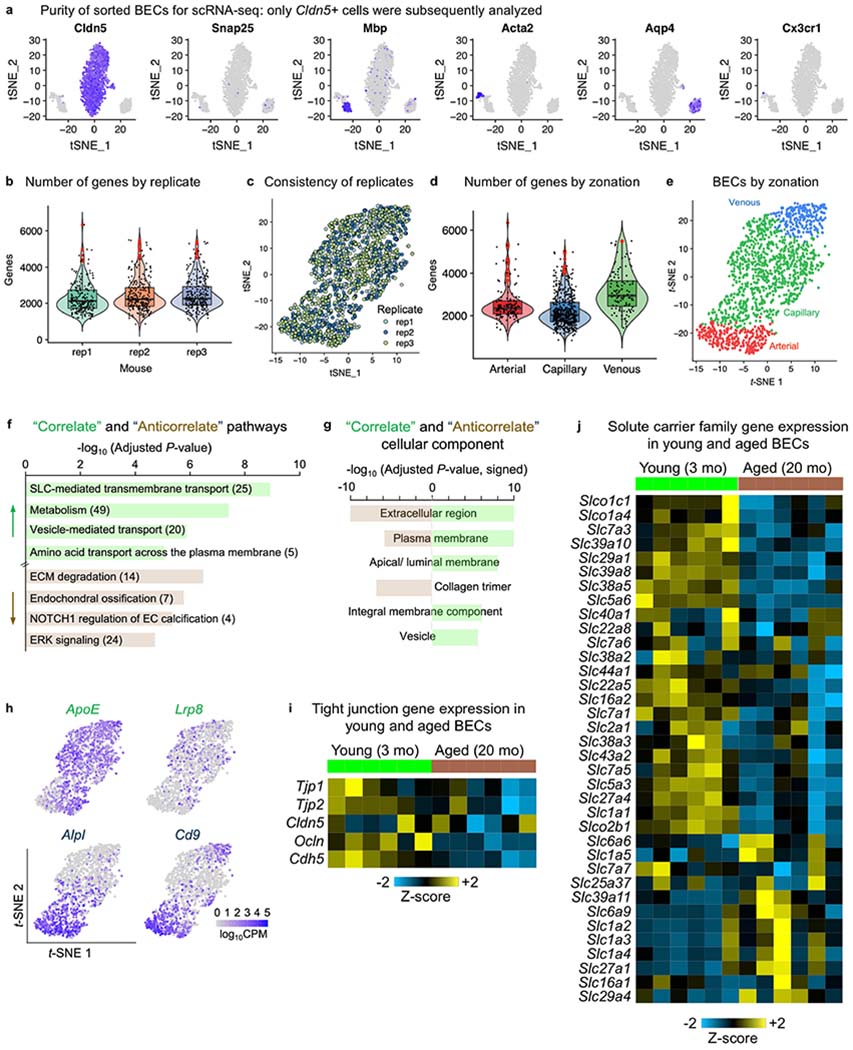
Extended Data Fig. 7|. Purity and consistency of sorted BECs for scRNA-seq and correlative plasma uptake analysis.

a, Sorted BECs from young (3-month-old) mice were further filtered to purity using scRNA-seq analysis using canonical cell-type markers (n = 3 young mice). b, Violin plot of the number of genes expressed per BEC within each biological replicate. Cells in red are outliers (745 total BECs from n = 3 young mice). Violin box plots show the median and the 25th to 75th percentiles, and the whiskers indicate the minimum and maximum. c, t-SNE plot with BECs from separate mice coloured distinctly, showing consistency in transcriptomes across replicates (745 total BECs from n = 3 young mice). d, Violin plot of the number of genes expressed per BEC by zonation. Cells in red are outliers (745 total BECs from n = 3 young mice). Violin box plots show the median and the 25th to 75th percentiles, and the whiskers indicate the minimum and maximum. e, t-SNE plot demonstrating BEC separation by arterial, capillary and venous zonation (n = 3 young mice). f, Pathway enrichment analysis of ‘Correlate’ and ‘Anticorrelate’ genes, with the number of genes in each pathway listed (from n = 3 young mice, GeneAnalytics analysis)81. ECM, extracellular matrix; SLC, solute carrier. g, Gene Ontology cellular component enrichment analysis of ‘Correlate’ and ‘Anticorrelate’ genes (from n = 3 young mice, GOrilla exact mHG P-value computation)82. h, Robust PCA plots of example ‘Correlate’ and ‘Anticorrelate’ gene expression across BECs. Each dot is an individual cell, and gene expression levels are indicated by the colour spectrum (log10 CPM, 745 total BECs from n = 3 young mice). i, Tight junction gene expression from RNA-seq of BECs from young (3 mo) and aged (20 mo) mice (n = 6). Relative Z-scored values are indicated in graded yellow (high) or blue (low). j, SLC transporter gene expression from RNA-seq of BECs from young (3 mo) and aged (20 mo) mice (n = 6). Relative Z-scored values are indicated in graded yellow (high) or blue (low). The SLC genes shown are derived from two comprehensive reviews83,84.
