
Extended Data Fig. 3|. BBB permeability and homeostasis after plasma injections, and brain uptake of plasma across injection volumes and chemistries.
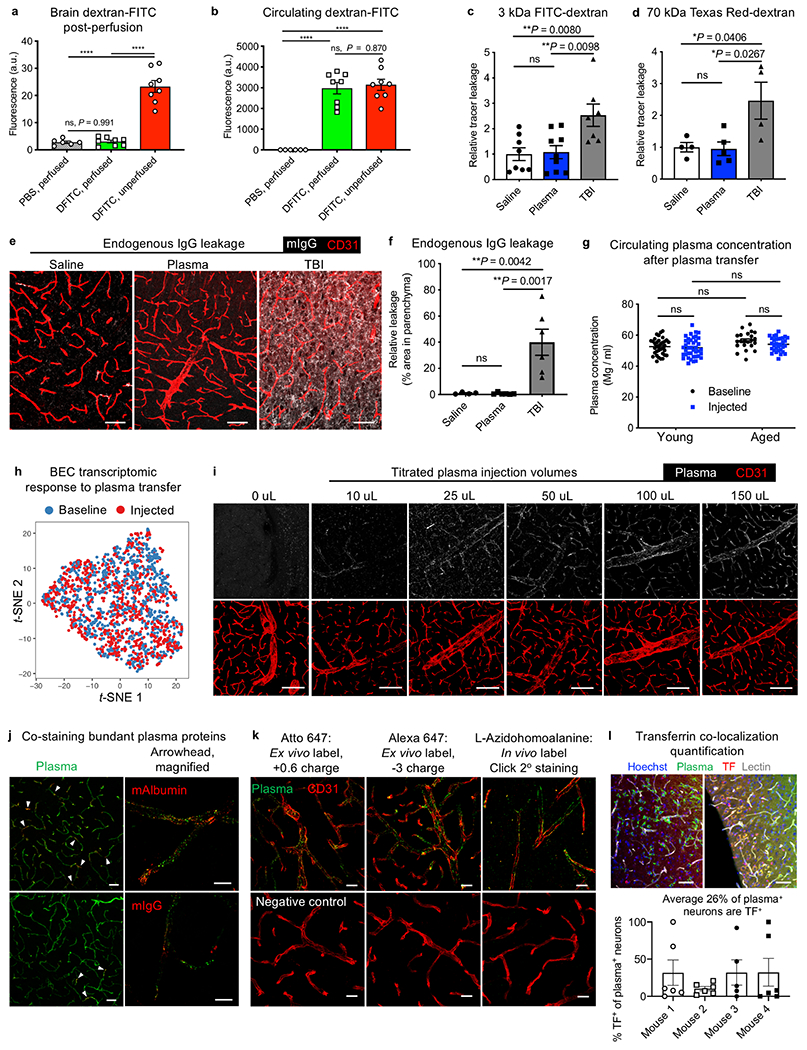
a, Assessment of perfusion completeness by measuring residual, intravenously injected 2 mDa dextran-FITC (DFITC) in brain tissue. No significant difference between dextran-FITC-injected and PBS-injected young (3-month-old) mice after perfusion (n = 6 PBS unperfused and n = 8 for the others; ****P < 0.0001, one-way ANOVA with Tukey’s multiple comparisons correction; mean ± s.e.m.). b, Circulating 2 mDa dextran-FITC in plasma at the time of death in d (n = 6 PBS unperfused and n = 8 for the others; ****P < 0.0001, one-way ANOVA with Tukey’s multiple comparisons correction; mean ± s.e.m.). c, d, BBB permeability after exposure to 150 μl saline or plasma was probed the next day by injections of 3-kDa (c) and 70-kDa (d) dextran tracers for quantification by fluorescence plate reader. Mild traumatic brain injury (TBI) served as a positive control for BBB leakage (for 3 kDa dextran: n = 8 saline, n = 9 plasma, n = 7 TBI; for 70 kDa dextran: n = 4 saline and TBI, n = 5 plasma; one-way ANOVA with Tukey’s multiple comparisons correction; mean ± s.e.m.). e, Representative images of endogenous immunoglobulin (white) extravasation into the parenchyma after exposure to 150 μl saline or plasma, or TBI75. Scale bars, 50 μm. f, Quantification of endogenous immunoglobulin (IgG) extravasation into the brain parenchyma after exposure to 150 μl saline or plasma, or TBI (n = 4 saline, n = 6 plasma and TBI; ns P = 0.9995, one-way ANOVA with Tukey’s multiple comparisons correction; mean ± s.e.m.). g, Plasma protein concentration of mice injected with 150 μl of plasma, 20 h later at time of death in young (3-month-old) and aged (20–24-month-old) mice used throughout the study compared to plasma concentrations at baseline (n = 35 young baseline, n = 35 young injected, n = 22 aged baseline, n = 32 aged injected; ns (left to right) P = 0.9923, P = 0.0657, P = 0.0657, P = 0.4302, P = 0.5430, two-way ANOVA with Sidak’s multiple comparisons test; mean ± s.e.m.). h, t-SNE plot of brain endothelial cells from young (3-month-old) mice at baseline and after exposure to 150 μl of plasma, demonstrating no significant perturbation of the cerebrovascular transcriptome upon plasma transfer (n = 3 mice). i, Representative brain images of Atto 647N-labelled plasma injected at various volumes, assayed 4 h later. 150 μl corresponds to 10–15 mg (0.5 mg/g body weight). CD31 marks brain endothelial cells. Scale bars, 100 μm. j, Representative brain images after Atto 647N-labelled plasma transfusion and stained for mouse albumin (mAlbumin; top) and mIgG (bottom). Minority of capillaries are albumin and IgG+ capillaries (arrowheads). Scale bars, 40 μm (left) and 10 μm (right). k, Atto 647N-labelled plasma (left), Alexa Fluor 647-labelled plasma (middle) and l-azidohomoalanine-labelled plasma, detected by sDIBO-647 click strain-promoted alkyne-azide cycloadditions (SPAAC) slice staining. In vivo labelled l-azidohomoalanine plasma76,77 was extracted and transfused into separate mice under normal (no l-azidohomoalanine) conditions. Scale bars, 20 μm. l, Representative images of after Atto 647N-labelled plasma transfusion and stained for mouse transferrin (top). Scale bars, 50 μm. In addition, quantification of the per cent of plasma+ neurons that also contain transferrin is shown (bottom, n = 4).