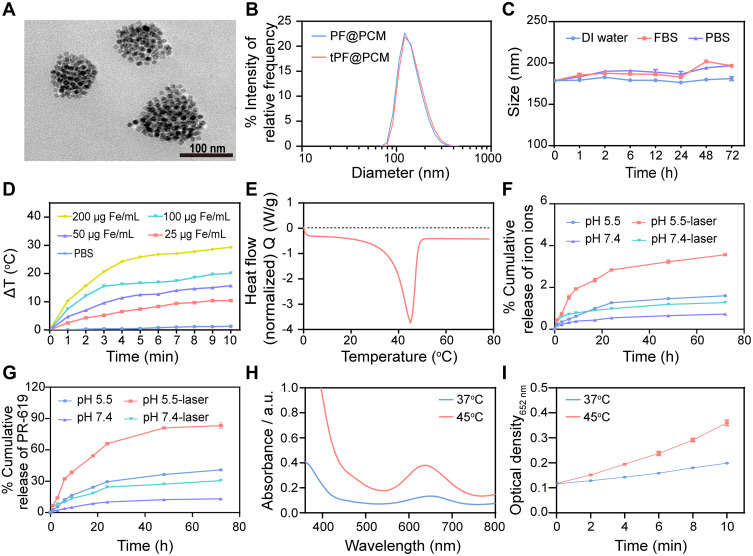
Figure 2.
Characterizations of tPF@PCM. (A) TEM image of tPF@PCM. Scale bar represents 100 nm. (B) Size distribution of PF@PCM and tPF@PCM in distilled (DI) water. (C) Stability of tPF@PCM in DI water, fetal bovine serum (FBS), and PBS at 37 °C for 72 h, respectively. (D) Photothermal heating curve of tPF@PCM at different concentrations. (E) Characterization of phase transformation of PCM measured by DSC. (F, G) Cumulative release of iron ions (F) and PR-619 (G) from tPF@PCM at pH 5.5 and 7.4 with or without NIR laser irradiation, respectively. (H) POD-like activity of tPF@PCM at 37 °C and 45 °C maintained by laser irradiation for 10 min. (I) Absorbance variation of tPF@PCM at 652 nm at different temperatures. Data are presented as mean ± SEM.

