Figure 3.
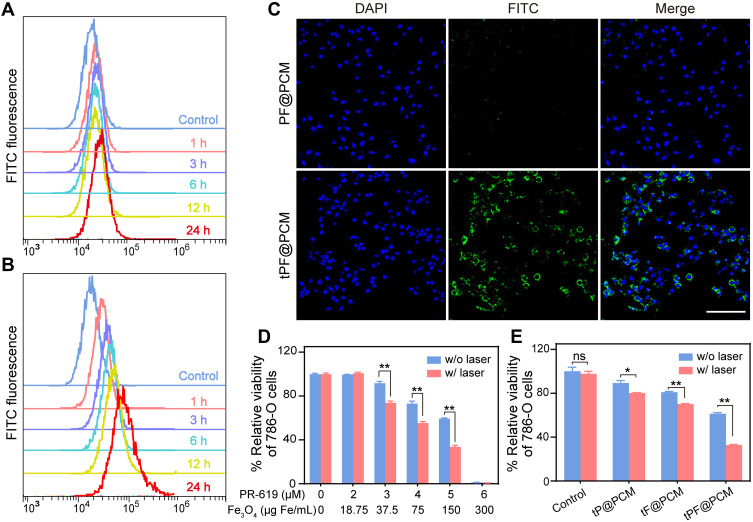
Cellular uptake and cytotoxicity of tPF@PCM. (A, B) Cellular uptake of FITC-labeled PF@PCM (A) and tPF@PCM (B) determined by flow cytometry. (C) CLSM images of 786-O cells co-incubated with FITC-labeled PF@PCM (top row) and tPF@PCM (bottom row) at 50 μg Fe/mL for 6 h. Cell nuclei were stained with DAPI (blue). Scale bar represents 200 μm. (D) Cytotoxicity evaluation of tPF@PCM with different concentrations of PR-619 and Fe3O4 NPs against 786-O cells with or without laser irradiation. **P < 0.01. (E) Cytotoxicity evaluation of tP@PCM, tF@PCM, and tPF@PCM (5 μM for PR-619; 150 μg Fe/mL for Fe3O4 NPs) against 786-O cells with or without laser irradiation. *P < 0.05; **P < 0.01; ns = P ≥ 0.05.

