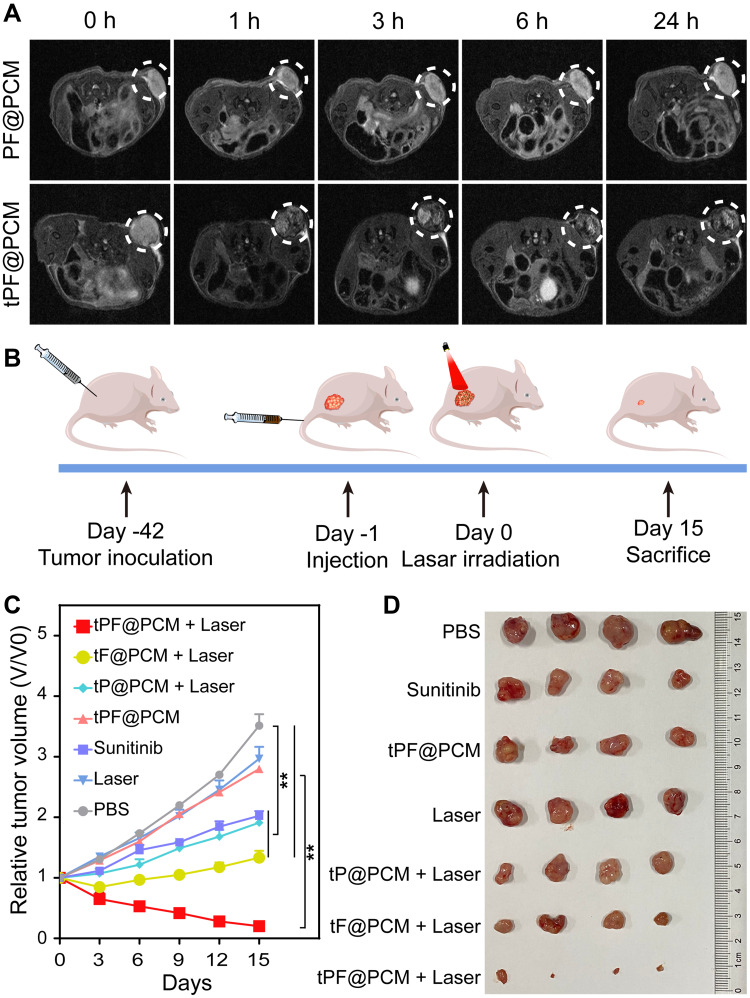
Figure 5.
In vivo magnetic resonance imaging (MRI) and synergetic anticancer therapy. (A) T2-weighted MR images of 786-O tumor-bearing mice (n = 3) at 0, 1, 3, 6, and 24 h post-injection of 15 mg Fe/kg body weight PF@PCM (top row) or tPF@PCM (bottom row). The white dotted circles represent tumors. (B) Schematic of the treatment regimen for 786-O tumor-bearing mice. (C) Tumor volume changes (n = 4) after different treatments. **P < 0.01. (D) Photos of the tumors extracted from mice in different groups at the end of treatments (day 15).

