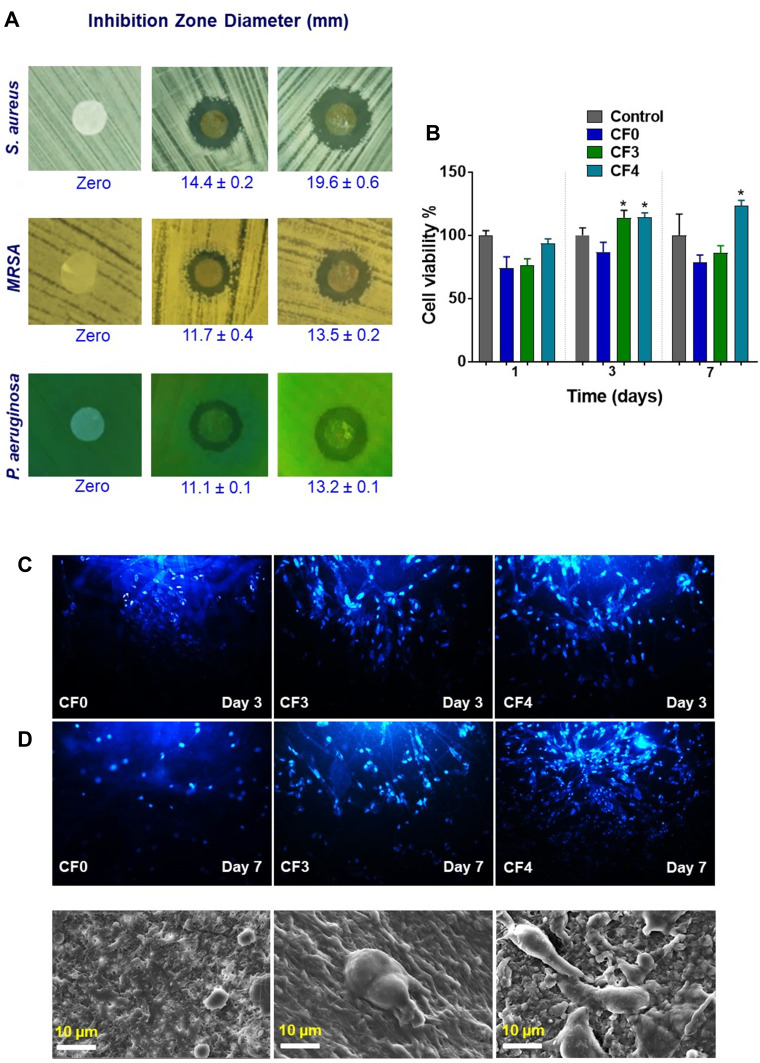
Figure 9.
Antibacterial activity of the proposed nanofibrous mats using the inhibition zone method (A), Cell viability test results. *p < 0.05 when compared to control (B), fluorescence images showing the proliferation of human fibroblasts (HFF-1) on the nanofibrous mats using DPAI staining after 3 and 7 days (C), and SEM micrographs of cells proliferation and adhesion on the nanofibrous mats (D). The red values in (A) represent the corresponding inhibition zone diameters in mm. The original SEM images with original scale bars are provided in the supporting information (Figure S3).

