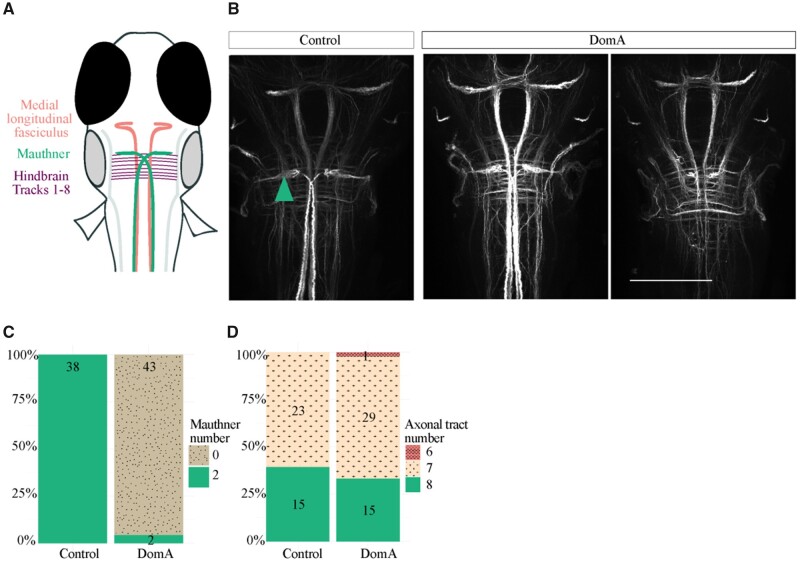
Figure 7.
The majority of DomA-exposed larvae do not have Mauthner cells but have other hindbrain and midbrain structures. A, Schematic of brains stained with α-3A10, which labels for the Mauthner cells, medial longitudinal fasciculus, and hindbrain axonal tracts. B, Representative images of brains from control and DomA-exposed larvae (5 dpf) stained with α-3A10. Teal arrow points to Mauthner cell. Scale bar = 100 μm. C, Score of the number of Mauthner cells (0–2) present in control and treated larvae. Numbers within each section represent the number of larvae with the given phenotype. D, Score of the number of hindbrain axonal tracts detectable in control and treated larvae. Numbers within each section represent the number of larvae with the given phenotype.

