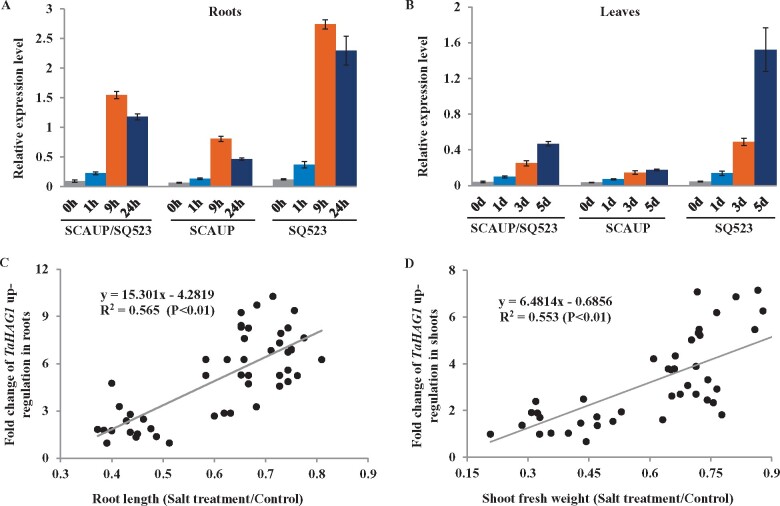
Figure 2.
Salinity-induced TaHAG1 expression was correlated with salt tolerance variation in polyploidy wheat. A and B, Expression patterns of the TaHAG1 gene in roots (A) and leaves (B) of synthetic allopolyploid wheat SCAUP/SQ523 and their parents SCAUP, SQ523 under salt stress. Seven-day-old seedlings grown in a hydroponic culture were treated with 200 mM NaCl for the indicated times. The expression of β-Actin was used to normalize mRNA levels. The values are means (±se) of three biological replicates. C and D, Correlation coefficients between the relative roots length (C), relative aboveground fresh weight (D) with the expression levels of TaHAG1 among different ploidy wheat accessions. The x-axis denotes a percentage of NaCl-treated seedlings relative to the same genotype grown on control condition. The y-axis denotes the fold change of TaHAG1 upregulation expression in root or shoot of wheat accessions with different ploidy before and after 200 mM NaCl treatment. Statistical significance was determined by ANOVA.

