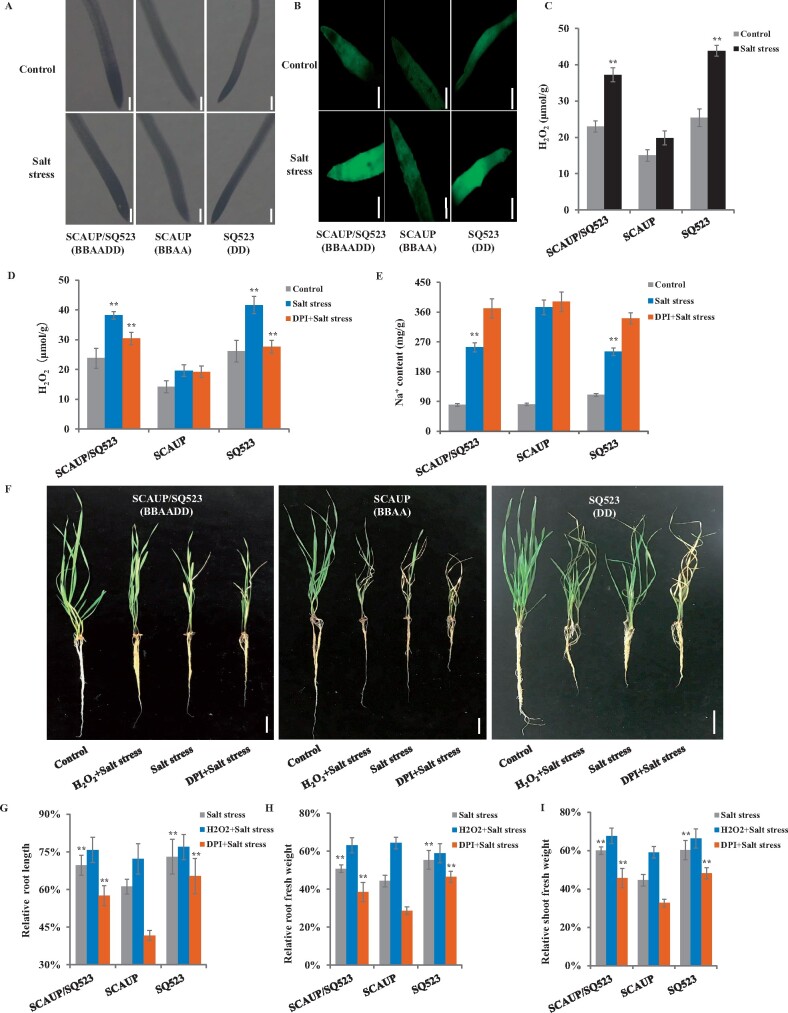
Figure 6.
Synthetic hexaploid wheat with increased ROS production than its tetraploid parent under salt stress. A and B, NBT staining (A) and H2DCF-DA probe labeling (B) of NaCl-induced ROS production in roots of synthetic allohexaploid wheat SCAUP/SQ523, its tetraploid parent, T. turgidum SCAUP, and its diploid parent, Ae. tauschii SQ523 under control or NaCl treatment. Dark shading or fluorescence activity indicates the accumulation of H2O2. Scale bars, 500 μm. C, H2O2 contents in the seedlings of SCAUP/SQ523 with its parents SCAUP and SQ523 plants under control and salt stress conditions. In (A–C), 7-d-old seedlings grown in hydroponic culture were treated with 200 mM NaCl for 9 h. D and E, Effects of exogenous DPI on changes in H2O2 production (D) and Na+ accumulation (E) of synthetic allohexaploid wheat SCAUP/SQ523 and its parents SCAUP and SQ523. Seven-day-old seedlings grown in hydroponic culture were treated with 200 mM NaCl for 1 d or 10 μM DPI + 200 mM NaCl for 1 d, then the H2O2 contents and Na+ accumulation were quantitated. F, Effects of exogenous H2O2 and DPI on salt resistance of synthetic allohexaploid wheat SCAUP/SQ523 and its parents SCAUP and SQ523 plants. Nonstressed or stressed 7-d-old seedlings grown for 3 weeks and then photographed and quantitated. Scale bar, 5 cm. Salt stress: 200 mM NaCl; H2O2 + Salt stress: 10 mM H2O2 together with 200 mM NaCl; DPI + Salt stress: pre-treatment with 10 μM DPI prior to 200 mM NaCl treatment. G–I, Comparison of the seedlings growth of SCAUP/SQ523 with its parents SCAUP and SQ523 plants in corresponding treatment in (F). The y-axis denotes a percentage of stress-treated seedlings relative to the same genotype grown on control conditions. Root length (G), root fresh weight (H), and shoot fresh weight (I). Mean and sd values were derived from measurements of at least 15 individuals of each kind of genotype. Similar results were obtained from three independent biological experiments. Asterisks indicate significant differences between SCAUP/SQ523, SQ523 plants with SCAUP plants under the same treatment (*P < 0.05, **P < 0.01 by two-sided t test).

