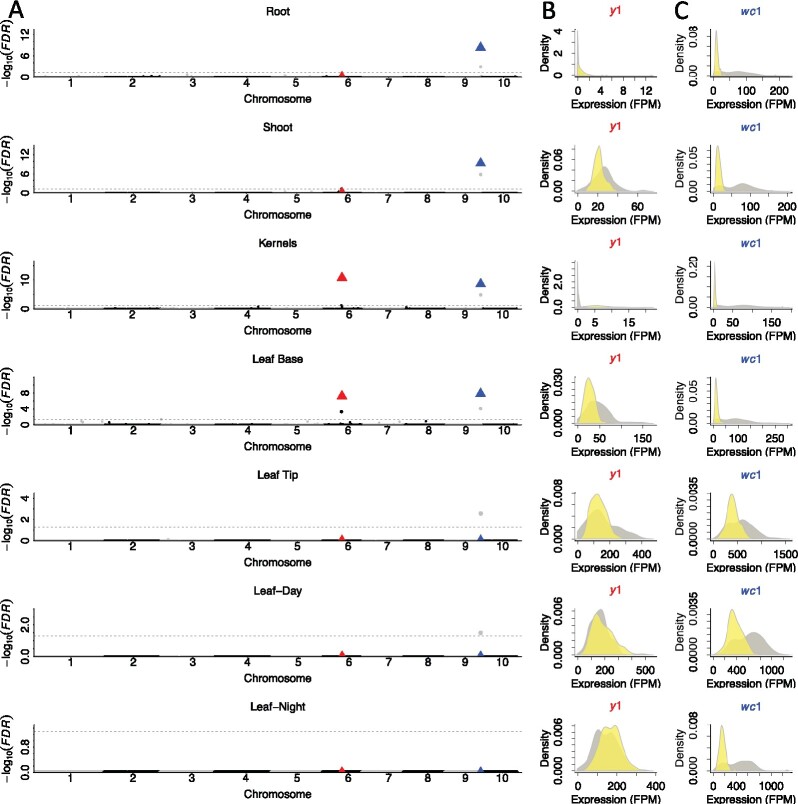
Figure 3.
Effects of tissue source on TWAS results for maize endosperm color. A, Manhattan plots of TWAS conducted for maize endosperm color on each of seven tissues; each dot represents a single gene. The gray points adjacent to wc1 designate GRMZM2G089421. Horizontal dashed lines designate the 0.05 FDR significance cutoff. The red and blue triangles represent the known causal loci, y1 and wc1, respectively. The distributions of expression levels of the y1 (B) and wc1 (C) genes in inbred lines with yellow (yellow) and white (gray) endosperms. The density plots show the probability density across each bandwidth. Sum of densities × bandwidth equals to 1.

