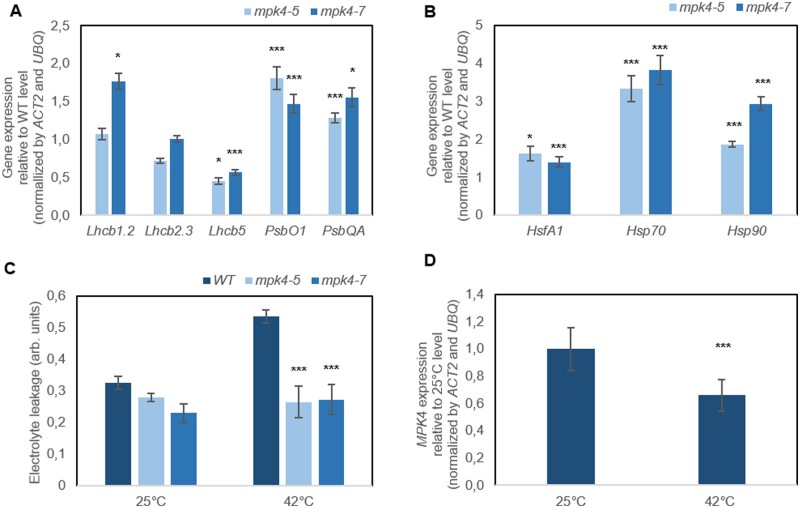
Figure 6.
Photoprotection and cell death inhibition in transgenic mpk4-5 and mpk4-7 plants in comparison to WT plants. A, Relative expression of Lhcb and PSB in mpk4 plants. B, Expression of HSF and HSP in mpk4 plants. The expression levels in (A) and (B) are presented relative to that in WT control plants, referred to as 1.0. C, High-temperature response expressed as leaf electrolyte leakage. The values on figures (A–C) are the means ± sds (n = 6). The asterisks indicate significant differences from the WT, as revealed by Tukey’s HSD test; *P < 0.05, ***P < 0.001. D, High temperature induced a response in the expression of the MPK4 gene in WT plants. The values are the means ± SDs (n = 6). The asterisks indicate significant differences from 25°C revealed by Tukey’s HSD test; ***P < 0.001.

