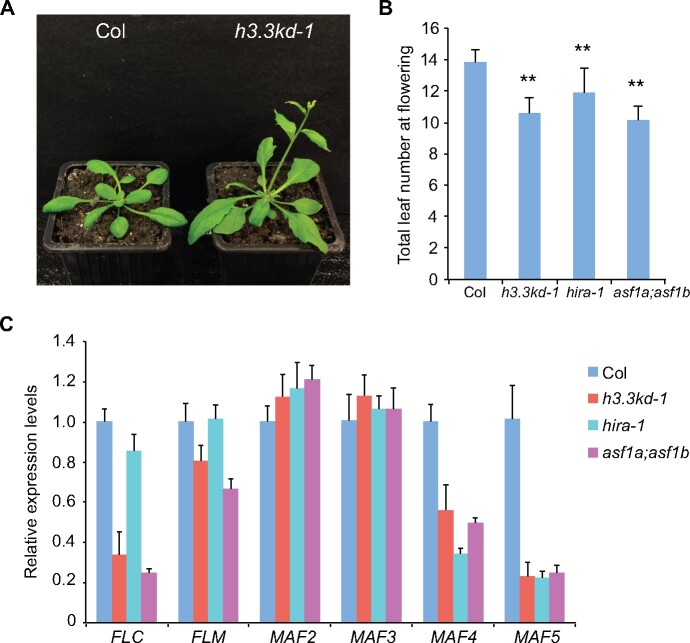
Figure 1.
H3.3 represses flowering and activates the expression of FLC and its homologs. A, The flowering phenotype of h3.3kd-1 grown in long days. B, The flowering time of indicated lines grown in long days. The total number of primary rosette and cauline leaves at flowering were counted; 15–20 plants were scored for each line. Values are means ± sd. Statistical significance relative to Col was determined by two-tailed Student’s t test (**P<0.01). C, Relative transcripts of FLC and its homologs determined by RT-qPCR. TUB2 was used as an endogenous control. Values are means ± sd of three biological repeats.

