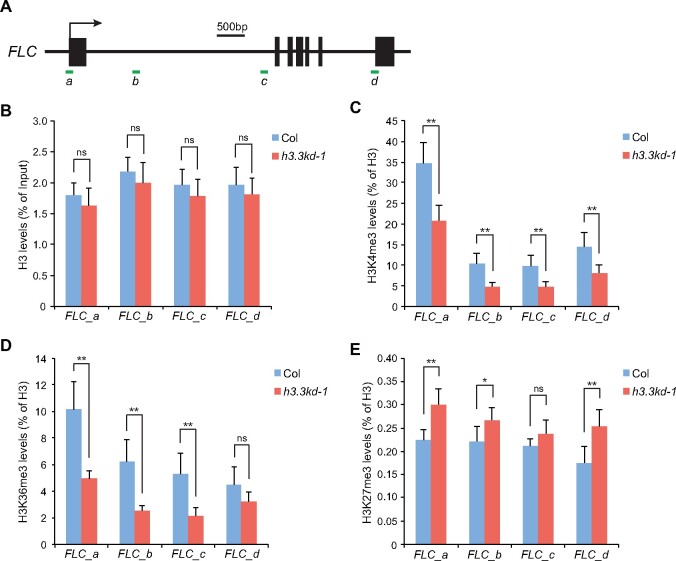
Figure 2.
H3.3 promotes active histone modifications at FLC. A, Schematic structure of FLC. Filled boxes represent exons; an arrow indicates the transcription start site. ChIP examined regions are indicated by green lines. B–E, H3 (B), H3K4me3 (C), H3K36me3 (D), and H3K27me3 (E) levels at FLC determined by ChIP. The amounts of immunoprecipitated DNA fragments were quantified by qPCR and subsequently normalized to input DNA (B) or H3 antibody-precipitated DNA (C–E). Values are means ± sd of three biological repeats. Statistical significance was determined by two-tailed Student’s t test (**P<0.01; *P<0.05; ns, not significant, P>0.05).

