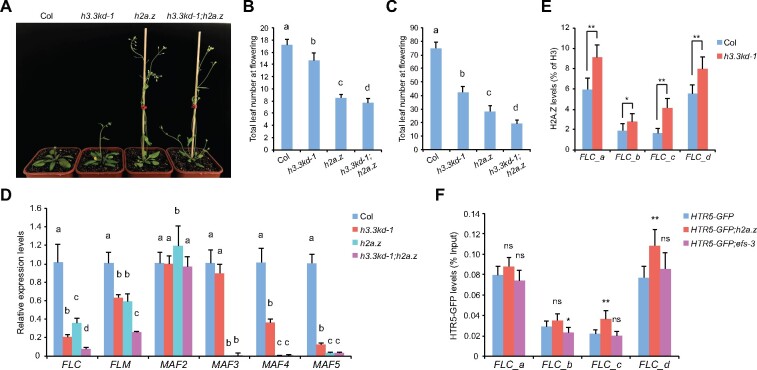
Figure 5.
H3.3 and H2A.Z oppose each other at the FLC chromatin but coactivate FLC expression. A, The flowering phenotype of indicated lines grown in long days. B and C, The flowering time of indicated lines grown in long days (B) and short days (C). The total number of primary rosette and cauline leaves at flowering were counted. For (B), 15–18 plants were scored for each line. For (C) 9 plants were scored for each line. Values are means ± sd. The significance of differences was tested using one-way ANOVA with Tukey’s test (P<0.05), different letters indicate statistical significance. D, Relative transcripts of FLC and its homologs determined by RT-qPCR. TUB2 was used as an endogenous control. Values are means ± sd of three biological repeats. The significance of differences at each gene was tested using one-way ANOVA with Tukey’s test (P<0.05), different letters indicate statistical significance. E, H2A.Z levels at FLC determined by ChIP. The amounts of immunoprecipitated DNA fragments were quantified by qPCR, and subsequently normalized to H3 antibody-precipitated DNA. Values are means ± sd of three biological repeats. Statistical significance was determined by two-tailed Student’s t test (*P<0.05; **P<0.01). F, HTR5-GFP enrichment levels at FLC in indicated lines. The amounts of immunoprecipitated DNA fragments were quantified by qPCR and normalized to input DNA. Values are means ± sd of three biological repeats. Statistical significance relative to HTR5-GFP was determined by two-tailed Student’s t test (*P<0.05; **P<0.01; ns, P>0.05).

