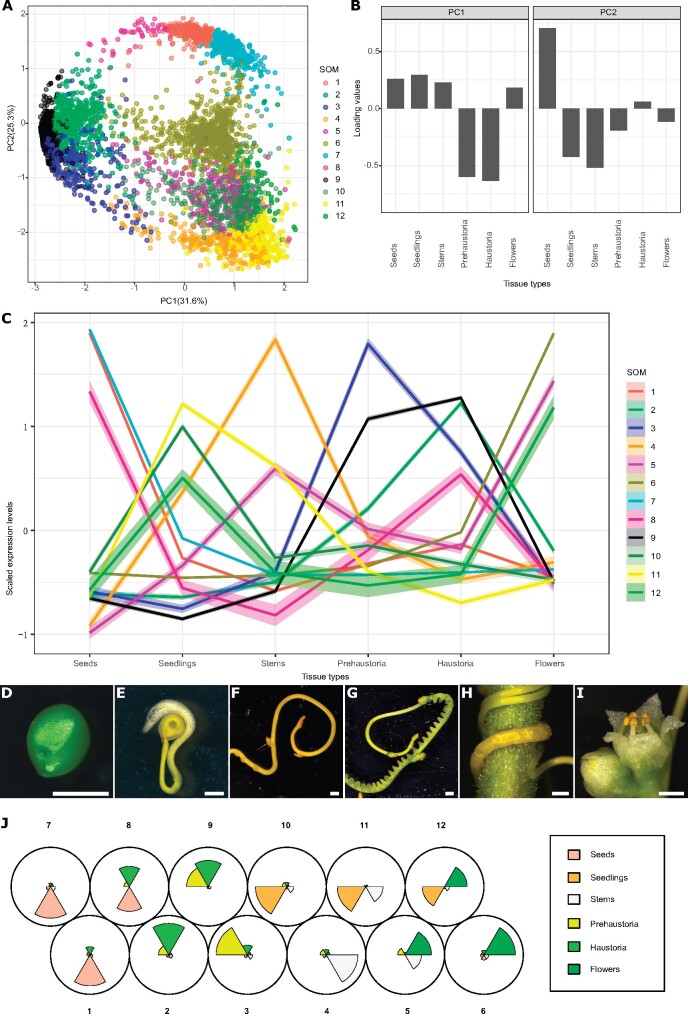
Figure 1.
PCA and SOMs clustering of gene expression in C. campestris tissue type RNA-seq data mapped to C. campestris genome. A, PCA analysis based on gene expression across different C. campestris tissues. Each dot represents a gene and is in the color indicating its corresponding SOM group. The percentage next to each axis indicates the proportion of variance that can be explained by the PC. B, Loading values of PC1 and PC2. PC1 separates the genes that are specifically expressed in intrusive tissues (prehaustoria and haustoria) from those that are expressed in nonintrusive tissues. PC2 divides the seed-specific genes from other genes. C, Scaled expression levels of each SOM group across different C. campestris tissue types. Each line is colored based on the corresponding SOM groups. The highlighting around the lines indicates a 95% confidence interval. D–I, The six different tissue types that were used in this transcriptomic study. Scale bars = 1 mm. D, Seed. E, Seedling. F, Stem. G, Prehaustoria. H, Haustoria. White arrowheads indicate haustoria. I, Flowers. J, A code plot of SOM clustering based on gene expression in C. campestris tissue type RNA-seq data mapped to the C. campestris genome. Each sector represents a tissue type and is in the color indicating its corresponding tissue type. The size of each sector illustrates the amount of expression from each tissue type in SOM groups.

