Figure 6.
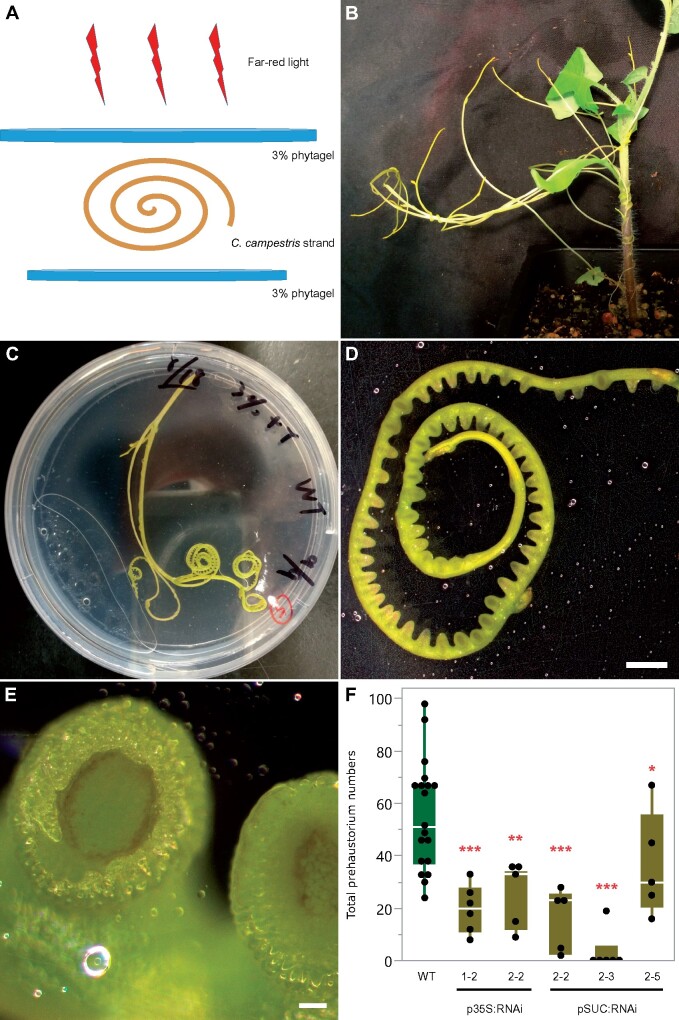
Far-red light-induced IVH phenotypes of C. campestris growing on T2 HIGS CcLBD25 RNAi transgenic plants. A, An illustration of the setup for the IVH system. Each C. campestris strand that was used in the IVH system is ∼10 cm long. B, Cuscuta campestris strands near the haustorium attachment sites. C, An IVH plate with a C. campestris strand sandwiched in between two layers of agar to provide sufficient physical contact signals. D and E, After illuminating these plates under far-light for 5 d, prehaustoria is readily visible. D, Scale bar = 2 mm. E, Scale bar = 100 µm. F, C. campestris strands were detached and subjected to IVH, and the numbers of prehaustoria were counted. Data presented are assessed using one-tailed Welch’s t test with WT as control. *P-value < 0.06; **P-value < 0.001; ***P-value < 0.0005. p35S:RNAi indicates the transgenic plants with the 35S promoter driving the CcLBD25 RNAi construct. pSUC:RNAi indicates the transgenic plants with the SUC2 promoter driving the CcLBD25 RNAi construct. The centerline in the box indicates the median. The bottom and top of the box indicate the 25th and 75th quantiles. The whiskers represent the expected variation of the data. The whiskers extend 1.5 times the interquartile range from the top and bottom of the box. All measured data points are plotted as black dots.

