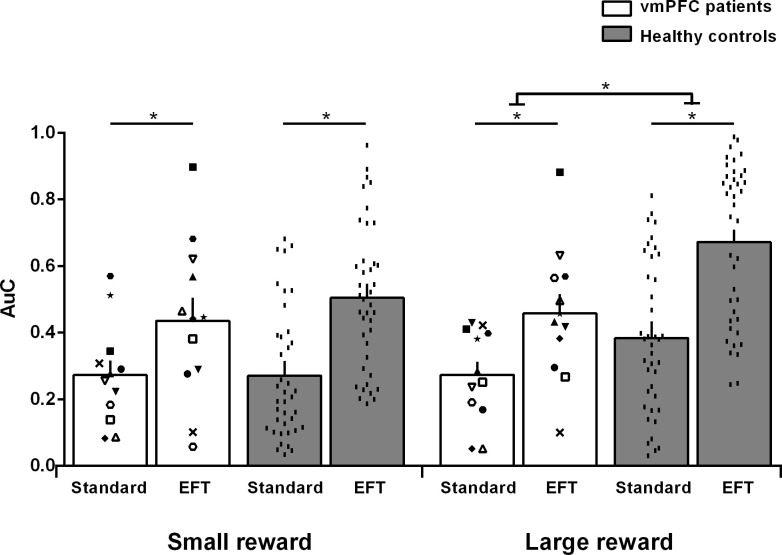
Figure 4. Area under the empirical discounting curve (AuC) by participant group, task condition, and reward magnitude.
The figure reports individual participants’ data. Empty symbols denote ventromedial prefrontal cortex (vmPFC) patients with brain damage touching the lateral prefrontal cortex. *p < 0.05 (data points available in the source data file: Figure 4—source data 1).

