. 2021 Aug 3;10:e67604. doi: 10.7554/eLife.67604

Figure 2. LRRK2-dependent mitophagy relies on the general autophagy machinery but is independent of the PINK1 pathway.

(A) Representative images of auto-QC primary MEF cultures treated with 10 nM GSK3357679A for 24 hr and immunolabelled with ATPB. Arrows show examples of autophagosomes containing mitochondria, and arrowheads show examples of autolysosomes containing mitochondria. Scale bars, 10 μm. (B) Quantitation of autophagosomes containing mitochondria shown in (B) or autolysosomes containing mitochondria shown in (C) from three independent experiments. (D) Representative images of WT and ATG5 KO mito-QC immortalised MEF cultures treated with 10 nM GSK3357679A for 24 hr. Corresponding quantitation from three independent experiments is shown below. Scale bars, 10 μm. (E) Representative transmission electron microscopy images from immortalised MEFs treated with 10 nM GSK3357679A for 24 hr. MLy: Mitolysosome; M: Mitochondria; A: autophagosome. Scale bars, 500 nm. (F) Quantitation of data in E from three independent experiments. (G) Representative images of PINK1 KO mito-QC primary MEF cultures treated with/without with 10 nM GSK3357679A for 24 hr. Scale bars, 10 μm. (H) Quantitation of the of mitophagic cells from data shown in G from 3 (4 for KO) independent experiments. (I) Immunoblots of the indicated proteins from WT and PINK1 KO primary MEFs (KO-1 and KO-3 are derived from different embryos) treated with/without 10 nM GSK3357679A or 10 μM CCCP for 24 hr. Overall data is represented as mean +/- SEM. Statistical significance is displayed as *p<0.05 and **p<0.01.

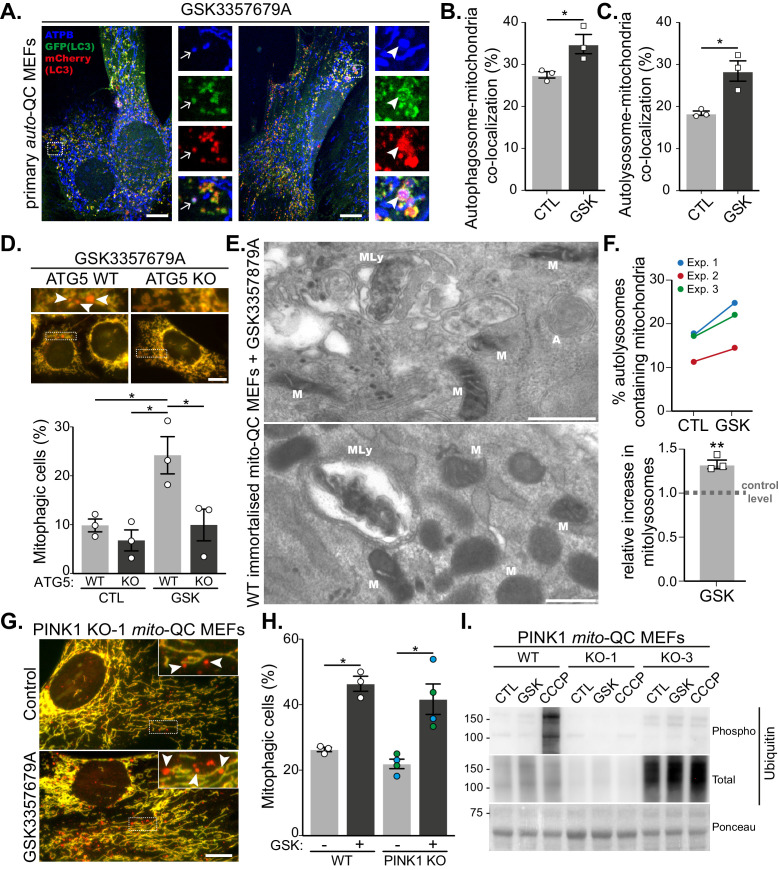
Figure 2—source data 1. Numerical data for Figure 2.
Figure 2—source data 2. Western blot raw data files for Figure 2I.

Figure 2.

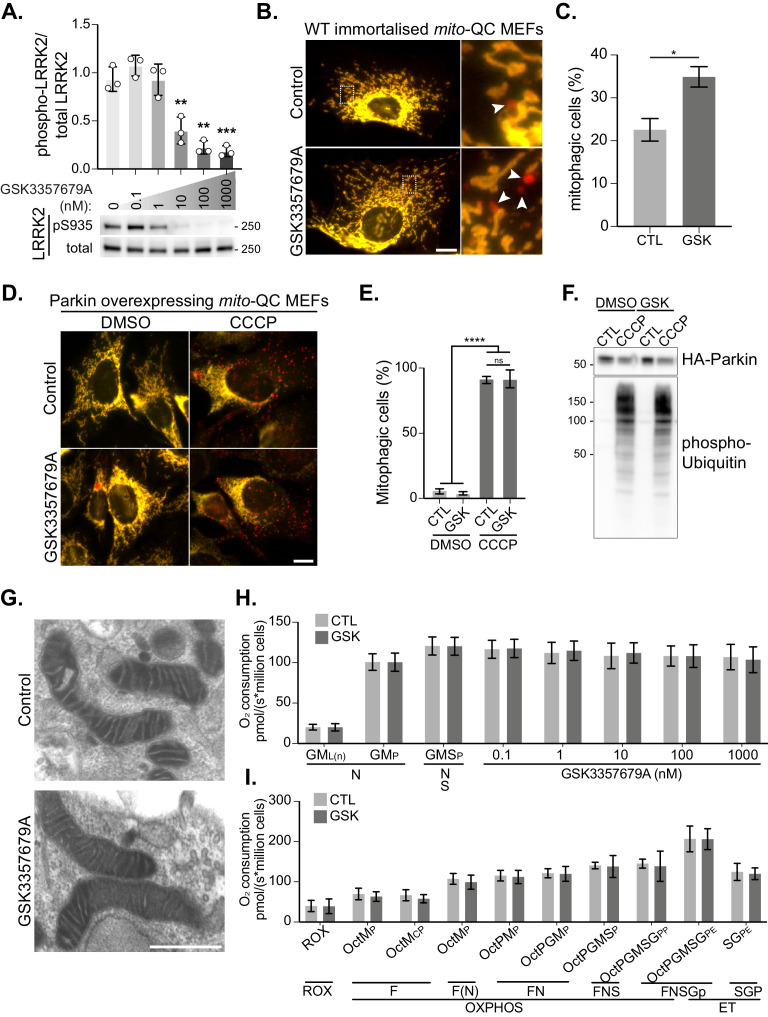
Figure 2—figure supplement 1. LRRK2-regulated mitophagy does not disrupt Parkin-dependent mitophagy and does not globally affect mitochondrial function.

Figure 2—figure supplement 1.

(A) Representative immunoblots of immortalised WT MEFs treated with increasing concentrations of GSK3357679A and quantitation (n=3). (B) Representative images of WT mito-QC immortalised MEF cultures treated with control (CTL) or 10 nM GSK3357679A. (C) Quantitation of mitophagy in mito-QC MEFs, from three independent experiments. (D) Representative images of Parkin overexpressing mito-QC primary MEF cultures treated with DMSO, 10 nM GSK3357679A, and 20 μM CCCP for 24 hr. (E) Quantitation of the data displayed in D. (F) Immunoblots of the indicated proteins in samples treated as in D. (G) Representative transmission electron microscopy images of mitochondria from immortalised MEFs treated with control or 10 nM GSK3357679A for 24 hr. (H) High-resolution respirometry of acute exposure to incremental doses of GSK3357679A following stimulation of the NS pathways in immortalised WT MEFs. (I) High-resolution respirometry of chronic (24 hr) exposure to 10 nM GSK3357679A. *p<0.05, **p<0.01, ***p<0.001, and ****p<0.0001.
Figure 2—figure supplement 1—source data 1. Numerical data for Figure 2—figure supplement 1.
Figure 2—figure supplement 1—source data 2. Western blot raw data files for Figure 2—figure supplement 1A.
Figure 2—figure supplement 1—source data 3. Western blot raw data files for Figure 2—figure supplement 1F.