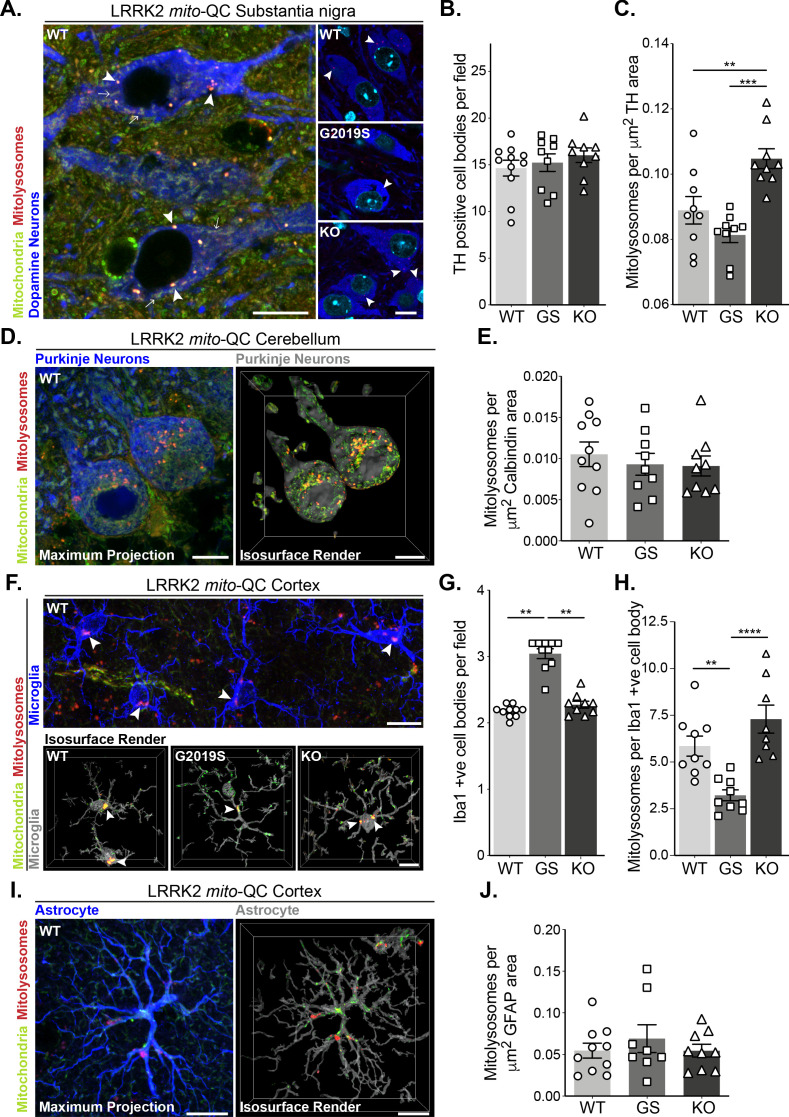
Figure 3. Mutation of LRRK2 in vivo alters brain mitophagy.
(A) Representative image of tyrosine hydroxylase (TH) immunolabelled dopaminergic neurons within the substantia nigra pars compacta (SNpc) undergoing basal mitophagy in LRRK2 WT, LRRK2 G2019S, and LRRK2 KO mito-QC mice. Arrowheads show examples of mitolysosomes and arrows indicate mitochondria. (B) Quantitation of the number of TH positive cells per field of view using a 63x objective. (C) Quantitation of basal mitophagy per μm (Sironi et al., 2020) of TH staining, data points represent means from individual mice. (D) Representative maximal intensity projection and isosurface render of calbindin immunolabelled Purkinje neurons in mito-QC cerebellum sections, undergoing basal mitophagy. (E) Quantitation of basal mitophagy per μm (Sironi et al., 2020) of calbindin staining, data points represent means from individual mice. (F) Representative image and isosurface renders of Iba1 immunolabelled microglia undergoing basal mitophagy in cortical sections from LRRK2 WT, LRRK2 G2019S, and LRRK2 KO mito-QC mice. Arrowheads highlight mitolysosomes. (G) Quantitation of the number of Iba1-positive cells in the brain cortex per field of view using a 63x objective. (H) Quantitation of basal mitophagy per Iba1-positive cell body, data points represent means from individual mice. (I) Representative maximal intensity projection and isosurface render of GFAP immunolabelled astrocytes undergoing basal mitophagy in mito-QC cortical sections. (J) Quantitation of basal mitophagy per μm (Sironi et al., 2020) of GFAP staining, data points represent means from individual mice. Scale bars, 10 μm. Overall data is represented as mean +/- SEM. Statistical significance is displayed as *p<0.05, **p<0.01, and ***p<0.001.


