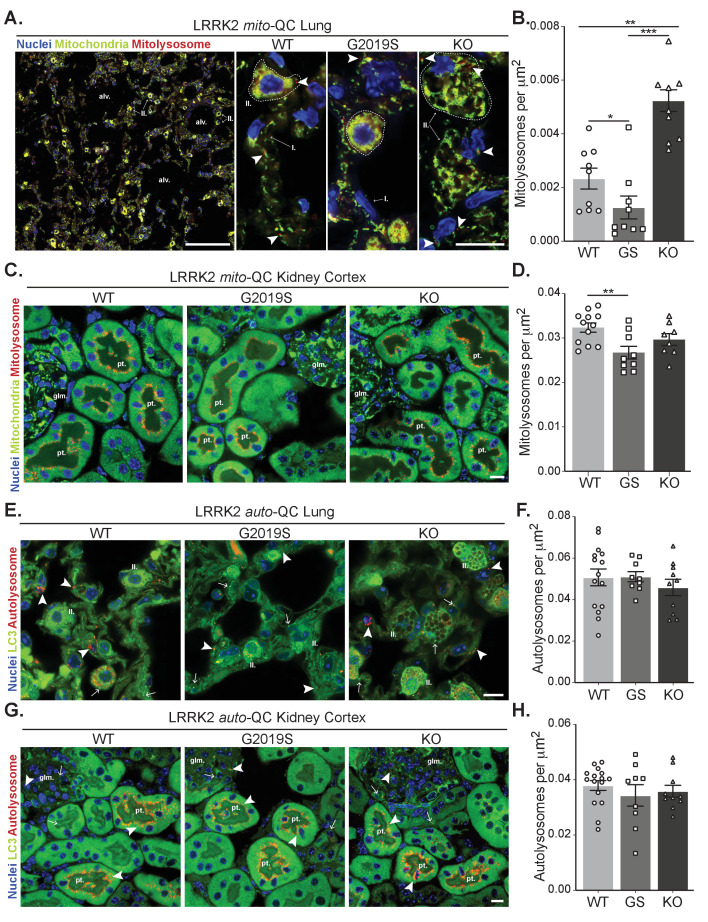
Figure 4. Effects of Lrrk2 genotype on basal mitophagy and macroautophagy in selected peripheral tissues.
(A) Representative tile scan and images of mito-QC lungs from LRRK2 WT, LRRK2 G2019S, and LRRK2 KO mice. Arrows on the tile scan highlight Type II pneumocytes (II.), alv. show alveoli. Arrowheads in the higher magnification images indicate examples of mitolysosomes and circled cells correspond to Type II pneumocytes (II.) and I. indicates Type I pneumocytes. (B) Quantitation of lung basal mitophagy from data shown in D, data points represent means from individual mice. (C) Representative images of mito-QC kidney cortex from LRRK2 WT, LRRK2 G2019S, and LRRK2 KO mice. glm. indicates glomeruli and pt. indicates proximal tubule examples. (D) Quantitation of kidney basal mitophagy from data shown in F, data points represent means from individual mice. (E) Representative images of auto-QC lungs from LRRK2 WT, LRRK2 G2019S, and LRRK2 KO mice. Arrowheads highlight autolysosomes, arrows indicate autophagosomes, and II. indicates Type II pneumocytes. (F) Quantitation of lung autophagy from data shown in C, data points represent means from individual mice. (G) Representative images of auto-QC kidney cortex from LRRK2 WT, LRRK2 G2019S, and LRRK2 KO mice. Arrowheads and, arrows as in C, glm. indicates glomeruli, and pt. indicates proximal tubules. (H) Quantitation of kidney autophagy from data shown in E, data points represent means from individual mice. Scale bars, Tile scan in A: 100 μm, Other pictures:10 μm. Overall data is represented as mean +/- SEM. Statistical significance is displayed as **p<0.01, and ***p<0.001.


