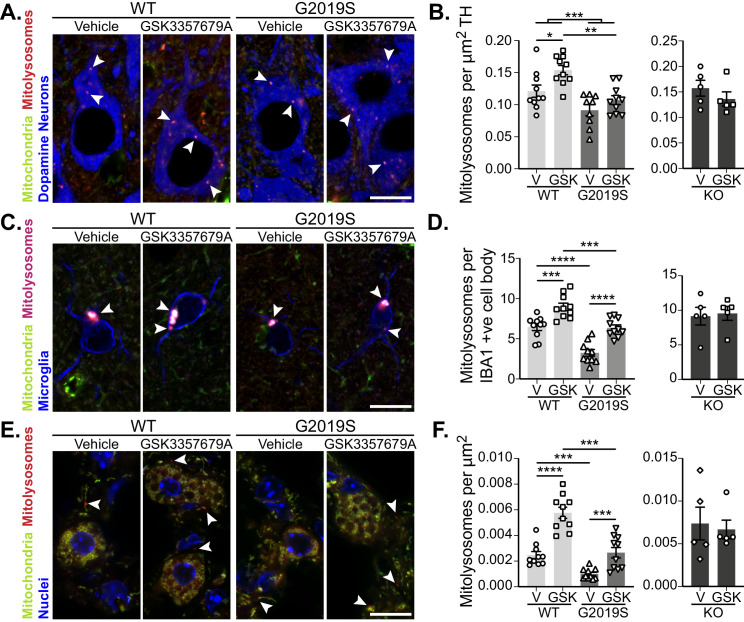
Figure 6. Pharmacological rescue of LRRK2-mediated mitophagy defects in vivo.
(A) Representative image of tyrosine hydroxylase (TH) immunolabelled dopaminergic neurons of the substantia nigra pars compacta in LRRK2 WT, LRRK2 G2019S, and LRRK2 KO mito-QC mice treated or not (vehicle) with GSK3357679A. Arrowheads indicate mitolysosome examples. (B) Quantitation of mitophagy from data shown in A, with the addition of LRRK2 KO. Each data point represents mean value from an individual mouse. (C) Representative images of Iba1 positive cortical microglia from LRRK2 WT, and LRRK2 G2019S mice treated or not (vehicle) with GSK3357679A. Arrowheads indicate mitolysosomes. (D) Quantitation of mitophagy from data shown in E, with the addition of LRRK2 KO. (E) Representative images of mito-QC lungs from LRRK2 WT, and LRRK2 G2019S mice treated or not (vehicle) with GSK3357679A. Arrowheads highlight mitolysosomes. (F) Quantitation of mitophagy from data shown in E, with the addition of LRRK2 KO. For (B), (D), and (F), V = vehicle dosed animals, GSK = GSK3357679A dosed animals. Each data point represents mean value from an individual mouse. Scale bars, 10 μm. Overall data is represented as mean +/- SEM. Statistical significance is displayed as *p<0.05, **p<0.01, ***p<0.001, and ****p<0.0001.


