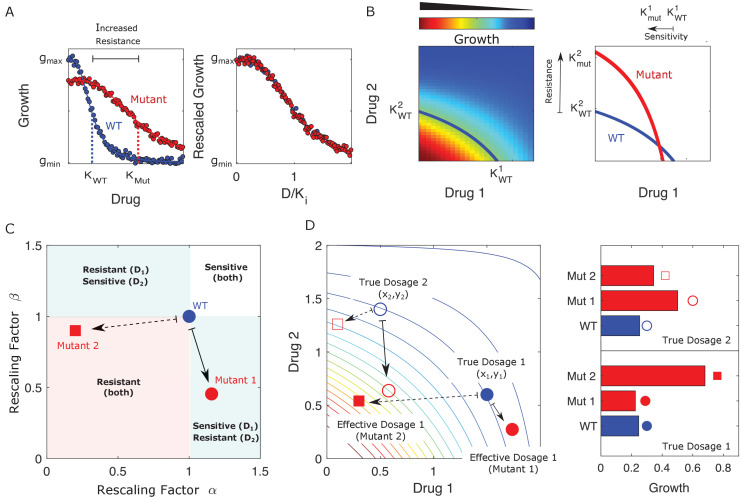
Figure 1. Drug resistance as a rescaling of effective drug concentration.
The fundamental assumption of our model is that drug-resistant mutants exhibit phenotypes identical to those of the ancestral (‘wild type’) cells but at rescaled effective drug concentration. (A) Left panel: schematic dose-response curves for an ancestral strain (blue) and a resistant mutant (red). Half-maximal inhibitory concentrations (,), which provide a measure of resistance, correspond to the drug concentrations where inhibition is half maximal. Fitness cost of resistance is represented as a decrease in drug-free growth. Right panel: dose-response curves for both cell types collapse onto a single functional form, similar to those in Chait et al., 2007; Michel et al., 2008; Wood and Cluzel, 2012; Wood et al., 2014. (B) Left panel: in the presence of two drugs, growth is represented by a surface; the thick blue curve represents the isogrowth contour at half-maximal inhibition; it intersects the axes at the half-maximal inhibitory concentrations for each individual drug. Right panel: isogrowth contours for ancestral (WT) and mutant cells. In this example, the mutant exhibits increases resistance to drug 2 and an increased sensitivity to drug 1, each of which corresponds to a rescaling of drug concentration for that drug. These rescalings are quantified with scaling constants and , where the superscripts indicate the drug (1 or 2). (C) Scaling factors for two different mutants (red square and red circle) are shown. The ancestral cells correspond to scaling constants . Mutant 1 exhibits increased sensitivity to drug 1 () and increased resistance to drug 2 (). Mutant 2 exhibits increased resistance to both drugs (), with higher resistance to drug 1. (D) Scaling parameters describe the relative change in effective drug concentration experienced by each mutant. While scaling parameters for a given mutant are fixed, the effects of those mutations on growth depend on the external environment (i.e., the drug dosage applied). This schematic shows the effective drug concentrations experienced by WT cells (blue circles) and the two different mutants (red circles and red squares) from panel (C) under two different external conditions (open and closed shapes). True dosage 1 (2) corresponds to higher external concentrations of drug 1 (2). The concentrations are superimposed on a contour plot of the two drug surface (similar to panel B). Right panel: resulting growth of mutants and WT strains at dosage 1 (bottom) and dosage 2 (top). Because the dosages are chosen along a contour of constant growth, the WT exhibits the same growth at both dosages. However, the growth of the mutants depends on the dose, with mutant 1 growing faster (slower) than mutant 2 under dosage 2 (dosage 1). A key simplifying feature of these evolutionary dynamics is that the selective regime (drug concentration) and phenotype (effective drug concentration) have same units.

