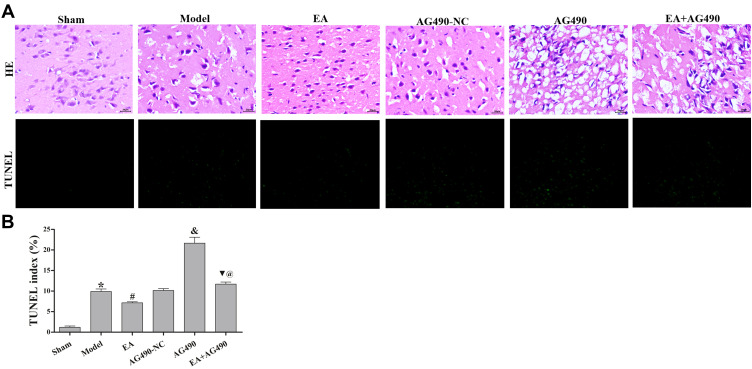
Figure 1.
Morphologic changes and neuronal apoptosis in the ischemic cortex. (A) Images show HE and TUNEL staining in each group (400×). (B). Statistical analysis of the TUNEL index in each group. The data are presented as the mean ± SD (n = 12). Compared to the sham group, *P<0.05. Compared to the model group, #P<0.05. Compared to the EA group, &P<0.05. Compared to the AG490 group, @P<0.05.

