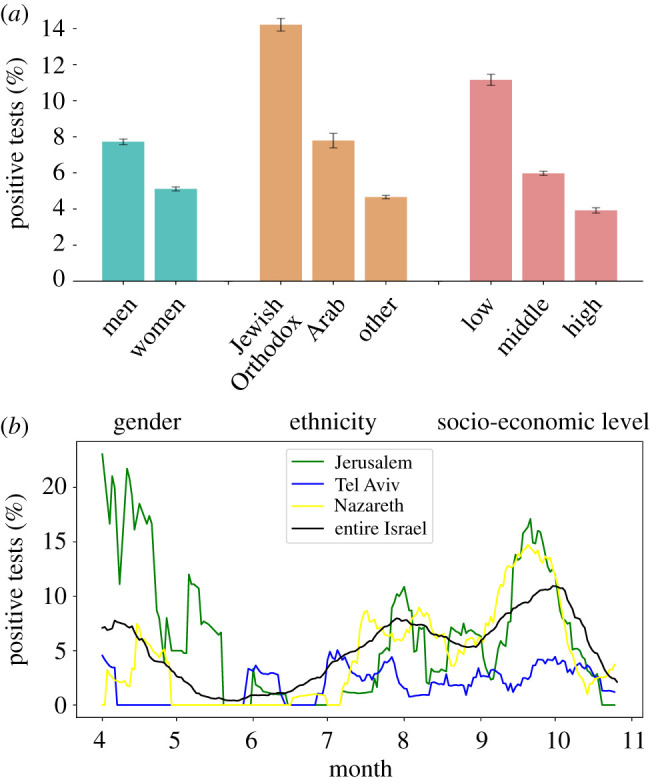
Figure 1.

Layers 1 and 2: sociodemographic information of the tested individual and the spatio-temporal dynamics of the disease. (a) Percentage of positive tests stratified by gender, ethnicity, and socio-economic level. The percentages of positive tests are linked with gender, ethnicity, and socio-economic level. Error bars represent the 95% confidence interval. (b) Percentage of positive tests over time for three clinics located in different cities and for the entire country. The value for each day is calculated as the percentage of positive tests over the 14 days preceding this day.
