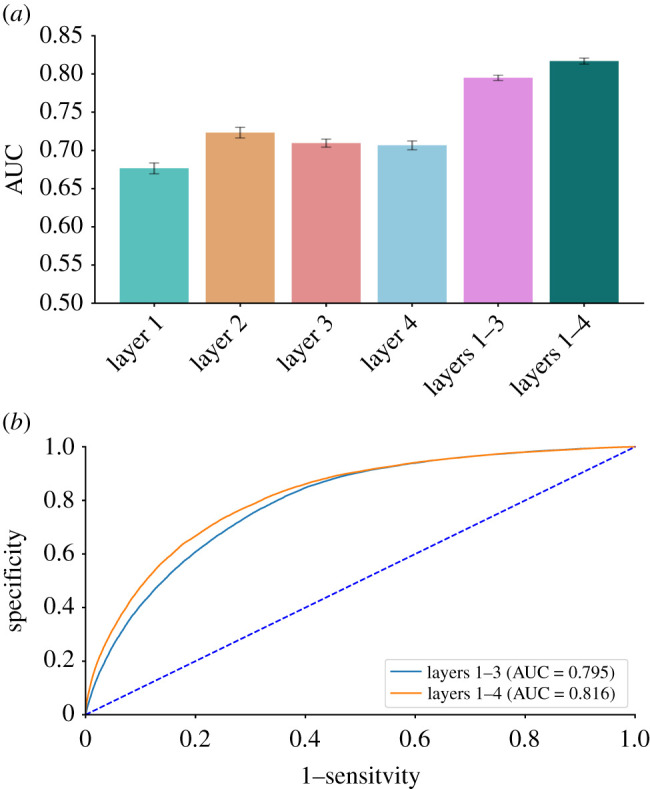
Figure 3.

Predictive models’ performance. (a) Mean AUC of models based on layers 1–4 (sociodemographic information of the tested individual, spatio-temporal patterns of the disease, medical condition and general health consumption of the tested individual, and information collected during the testing episode) and the full model that combines all four layers. The full model yielded considerably better classification between COVID-19-positive and COVID-19-negative tests, with a mean AUC of 81.6%. Error bars represent the standard deviation of the 10 executions of the model. (b) Receiver operating characteristic curves for the full model and the model considering layers 1–3. The full model’s classification ability is only slightly better than that of the model considering the first three layers (i.e. excluding layer 4: information collected during the testing episode).
