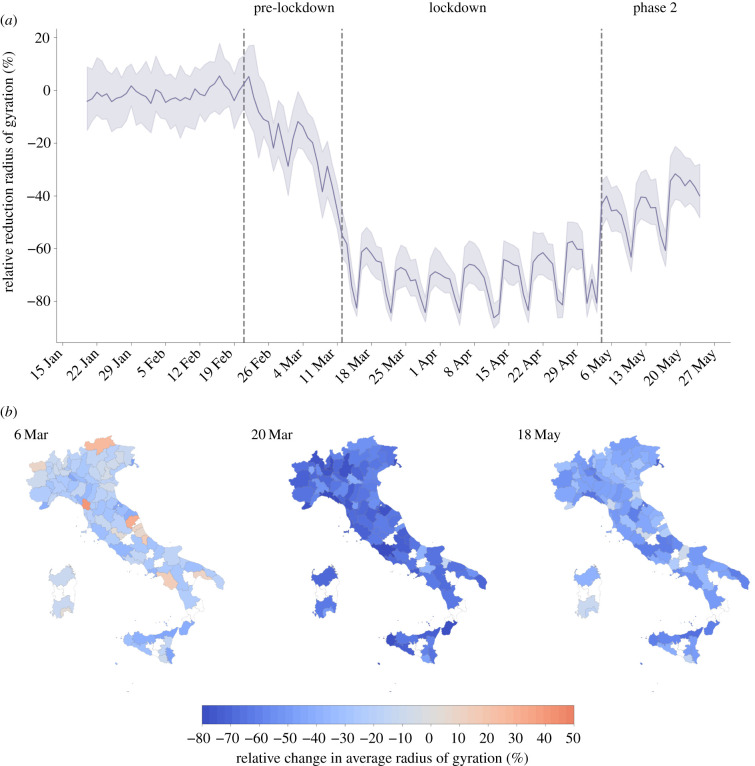
Figure 1.
Mobility responses during the COVID-19 pandemic in Italy. Time series of the relative reduction with respect to the baseline of the median radius of gyration in Italy (a). The solid line indicates the median value computed across the 107 Italian provinces, while the shaded area corresponds to the 50% reference range. Dashed vertical lines mark the dates that define the three phases of the pandemic response: the pre-lockdown (between 21 February and 11 March), the lockdown (between 12 March and 4 May) and the phase 2 (after 4 May). Spatial patterns of mobility reductions (b). Each map shows the relative change in the average radius of gyration with respect to the baseline, by province, on 3 different days, one for each period under study. Provinces in white are not included in the analysis because of low population sampling (less than 100 users).

