Figure 8.

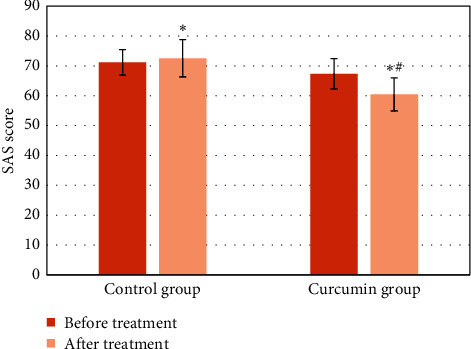
Comparison of SAS scores between the two groups before and after treatment (∗ means P < 0.05 versus that before treatment, and # means P < 0.05 versus that of the control group).

Comparison of SAS scores between the two groups before and after treatment (∗ means P < 0.05 versus that before treatment, and # means P < 0.05 versus that of the control group).